Bed, Bath and Beyond 2008 Annual Report Download - page 2
Download and view the complete annual report
Please find page 2 of the 2008 Bed, Bath and Beyond annual report below. You can navigate through the pages in the report by either clicking on the pages listed below, or by using the keyword search tool below to find specific information within the annual report.-
 1
1 -
 2
2 -
 3
3 -
 4
4 -
 5
5 -
 6
6 -
 7
7 -
 8
8 -
 9
9 -
 10
10 -
 11
11 -
 12
12 -
 13
13 -
14
-
15
-
16
-
17
-
18
-
19
-
20
-
21
-
22
-
23
-
24
-
25
-
26
-
27
-
28
-
29
-
30
-
31
-
32
-
33
-
34
-
35
-
36
-
37
-
38
-
39
-
40
-
41
-
42
-
43
-
44
-
45
-
46
-
47
-
48
-
49
-
50
-
51
-
52
-
53
-
54
-
55
-
56
-
57
-
58
-
59
-
60
-
61
-
62
-
63
-
64
-
65
-
66
-
67
-
68
-
69
-
70
-
71
-
72
-
73
-
74
-
75
-
76
-
77
-
78
-
79
-
80
 |
 |

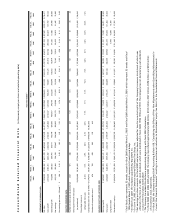
STATEMENT OF EARNINGS DATA
Net sales $7,208,340 $7,048,942 $6,617,429 $5,809,562 $5,147,678 $4,477,981 $3,665,164 $2,927,962 $2,396,655 $1,857,505 $1,382,345 $1,057,135 $816,912 $597,352 $437,807 $304,571 $216,411
Gross profit2,873,236 2,925,231 2,835,402 2,485,748 2,186,301 1,876,664 1,518,547 1,207,566 986,459 766,801 576,125 441,016 341,168 250,036 183,819 127,972 90,528
Operating profit673,896 838,022 889,401 879,171 792,414 639,343 480,057 346,100 272,838 209,340 158,052 118,914 90,607 67,585 51,685 36,906 26,660
Net earnings 425,123 562,808 594,244 572,847 504,964 399,470 302,179 219,599 171,922 131,229 97,346 73,142 55,015 39,459 30,013 21,887 15,960
Net earnings per share – Diluted (4) $1.64 $2.10 $2.09 $1.92 $1.65 $1.31 $1.00 $0.74 $0.59 $0.46 $0.34 $0.26 $0.20 $ 0.14 $ 0 .11 $ 0.08 $ 0.06
SELECTED OPERATING DATA
Number of stores open (at period end) 1,037 971 888 809 721 629 519 396 311 241 186 141 108 80 61 45 38
Total square feet of store space
(at period end) 32,050,000 30,181,000 27,794,000 25,502,000 22,945,000 20,472,000 17,452,000 14,724,000 12,204,000 9,815,000 7,688,000 5,767,000 4,347,000 3,214,000 2,339,000 1,512,000 1,128,000
Percentage increase in
comparable store sales (2.4)% 1.0% 4.9% 4.6% 4.5% 6.3% 7.9% 7.1% 5.0% 9.2% 7.6% 6.4% 6.1% 3.8% 12.0% 10.6% 7.2%
Comparable store net sales (in 000’s) (5) $6,746,472 $6,457,268 $6,068,694 $5,281,675 $4,468,095 $3,902,308
Number of comparable stores (5) 874 792 683 605 535 416
BALANCE SHEET DATA (AT PERIOD END)
Working capital $1,609,831 $1,065,599 $1,553,541 $1,082,399 $1,223,409 $1,199,752 $914,220 $715,439 $532,524 $360,585 $267,557 $188,293 $127,333 $91,331 $74,390 $56,001 $34,842
Total assets 4,268,843 3,844,093 3,959,304 3,382,140 3,199,979 2,865,023 2,188,842 1,647,517 1,195,725 865,800 633,148 458,330 329,925 235,810 176,678 121,468 76,654
Long-term debt – – – – – – – – – – – – – 5,000 16,800 13,300 –
Shareholders’ equity (6) $3,000,454 $2,561,828 $2,649,151 $2,262,450 $2,203,762 $1,990,820 $1,451,921 $1,094,350 $817,018 $559,045 $411,087 $295,397 $214,361 $151,446 $108,939 $77,305 $54,643
Consolidated Selected Financial Data (in thousands, except per share and selected operating data)
Fiscal Year Ended (1)
Feb. 28, March 1, March 3, Feb. 25, Feb. 26, Feb. 28, March 1, March 2, March 3, Feb. 26, Feb. 27, Feb. 28, March 1, Feb. 25, Feb. 26, Feb. 27, Feb. 28,
2009 2008 (2) 2007 2006 2005 2004 (3) 2003 2002 2001 2000 1999 1998 1997 1996 1995 1994 1993
(1) Each fiscal year represents 52 weeks, except for fiscal 2006 (ended March 3, 2007) and fiscal 2000 (ended March 3, 2001) which represent 53 weeks and fiscal
1996 (ended March 1, 1997) which represents 52 weeks and 6 days.
(2) On March 22, 2007, the Company acquired Buy Buy BABY, Inc.
(3) On June 19, 2003, the Company acquired Christmas Tree Shops, Inc.
(4) Net earnings per share amounts for fiscal 2000 and prior have been adjusted for two-for-one stock splits of the Company’s common stock (each of which was
effected in the form of a 100% stock dividend), which were distributed in fiscal 2000, 1998, 1996 and 1993. The Company has not declared any cash dividends
in any of the fiscal years noted above.
(5) The Company has added this disclosure prospectively beginning with fiscal 2003 information.
(6) In fiscal 2008, 2007, 2006, 2005 and 2004, the Company repurchased approximately $48 million, $734 million, $301 million, $598 million and $350 million
of its common stock, respectively.
(7) In fiscal 2006, the Company adopted Staff Accounting Bulletin 108, ”Considering the Effects of Prior Year Misstatements when Quantifying Misstatements in
Current Year Financial Statements” resulting in a one-time net reduction to Shareholders’ equity. See Note 3 in the Consolidated Financial Statements.
(7)