Bed, Bath and Beyond 2008 Annual Report Download - page 6
Download and view the complete annual report
Please find page 6 of the 2008 Bed, Bath and Beyond annual report below. You can navigate through the pages in the report by either clicking on the pages listed below, or by using the keyword search tool below to find specific information within the annual report.-
 1
1 -
 2
2 -
 3
3 -
 4
4 -
 5
5 -
 6
6 -
 7
7 -
 8
8 -
 9
9 -
 10
10 -
 11
11 -
 12
12 -
 13
13 -
 14
14 -
 15
15 -
 16
16 -
 17
17 -
18
-
19
-
20
-
21
-
22
-
23
-
24
-
25
-
26
-
27
-
28
-
29
-
30
-
31
-
32
-
33
-
34
-
35
-
36
-
37
-
38
-
39
-
40
-
41
-
42
-
43
-
44
-
45
-
46
-
47
-
48
-
49
-
50
-
51
-
52
-
53
-
54
-
55
-
56
-
57
-
58
-
59
-
60
-
61
-
62
-
63
-
64
-
65
-
66
-
67
-
68
-
69
-
70
-
71
-
72
-
73
-
74
-
75
-
76
-
77
-
78
-
79
-
80
 |
 |

BED BATH & BEYOND 2008 ANNUAL REPORT
4
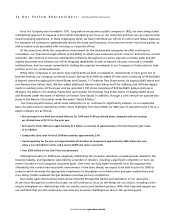
•Net earnings for the fiscal year (fifty-two weeks) ended February 28, 2009 were $1.64 per diluted share ($425.1 million),
compared to fiscal 2007 (fifty-two weeks) net earnings of $2.10 per diluted share ($562.8 million) and fiscal 2006 (fifty-three
weeks) net earnings of $2.09 per diluted share ($594.2 million). Net earnings per diluted share include the impact of the
Company’s repurchases of its common stock.
During fiscal 2008, 2007 and 2006, the Company’s capital expenditures were $215.9 million, $358.2 million and $317.5 million.
Included in fiscal 2007’s capital expenditures were costs associated with a new distribution center and a new E-service fulfillment
center to support the Company’s growth.
Since May 2008, the Company, through a joint venture, operates two stores in Mexico under the name “Home & More.” The cost
of investment in the joint venture totaled approximately $4.8 million, including fees.
The Company plans to continue to expand its operations and invest in its infrastructure to reach its long-term objectives. In fiscal
2009, the Company expects to open approximately 50 to 54 new stores, including approximately 35 BBB stores throughout the
United States and Canada, approximately six to eight CTS stores, approximately eight to ten buybuy BABY stores and one Harmon
store. During fiscal 2008, the Company opened a total of 67 new stores, including 49 BBB stores throughout the United States and
Canada, 11 CTS stores, one Harmon store and six buybuy BABY stores and closed one Harmon store. The Company currently has
no outstanding bank borrowings, and for fiscal 2009, expects its operations to be entirely funded from internally generated
sources.
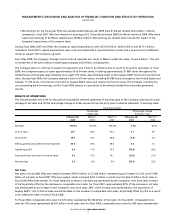
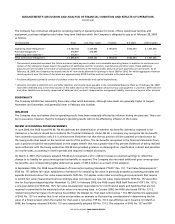
RESULTS OF OPERATIONS
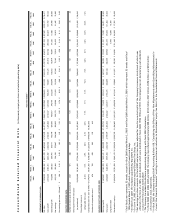
The following table sets forth for the periods indicated (i) selected statement of earnings data of the Company expressed as a per-
centage of net sales and (ii) the percentage change in dollar amounts from the prior year in selected statement of earnings data:
Fiscal Year Ended
Percentage Percentage Change
of Net Sales from Prior Year
February 28, March 1, March 3, February 28, March 1,
2009 2008 2007 2009 2008
Net sales 100.0% 100.0% 100.0% 2.3% 6.5%
Cost of sales 60.1 58.5 57.2 5.1 9.0
Gross profit 39.9 41.5 42.8 (1.8) 3.2
Selling, general and administrative expenses 30.5 29.6 29.4 5.4 7.3
Operating profit 9.3 11.9 13.4 (19.6) (5.8)
Earnings before provision for income taxes 9.5 12.3 14.1 (21.0) (7.3)
Net earnings 5.9 8.0 9.0 (24.5) (5.3)
Net Sales
Net sales in fiscal 2008 (fifty-two weeks) increased $159.4 million to $7.208 billion, representing an increase of 2.3% over $7.049
billion of net sales in fiscal 2007 (fifty-two weeks), which increased $431.5 million or 6.5% over the $6.617 billion of net sales in
fiscal 2006 (fifty-three weeks). For fiscal 2008, the increase in net sales was generated by the Company’s new store sales increase
of 4.6% partially offset by the decrease in comparable store sales. For fiscal 2007, approximately 82% of the increase in net sales
was attributable to an increase in the Company’s new store sales, 26% of the increase was attributable to the acquisition of
buybuy BABY,15% of the increase was attributable to the increase in comparable storesales, all partially offset by 23% as a result
of an additional week of sales in fiscal 2006.
For fiscal 2008, comparable storesales for 874 stores represented $6.746 billion of net sales; for fiscal 2007, comparable store
sales for 792 stores represented $6.457 billion of net sales; and for fiscal 2006, comparable store sales for 683 stores represented
MANAGEMENT’S DISCUSSION AND ANALYSIS OF FINANCIAL CONDITION AND RESULTS OF OPERATIONS
(continued)