Bed, Bath and Beyond 2008 Annual Report Download - page 7
Download and view the complete annual report
Please find page 7 of the 2008 Bed, Bath and Beyond annual report below. You can navigate through the pages in the report by either clicking on the pages listed below, or by using the keyword search tool below to find specific information within the annual report.-
 1
1 -
 2
2 -
 3
3 -
 4
4 -
 5
5 -
 6
6 -
 7
7 -
 8
8 -
 9
9 -
 10
10 -
 11
11 -
 12
12 -
 13
13 -
 14
14 -
 15
15 -
 16
16 -
 17
17 -
 18
18 -
19
-
20
-
21
-
22
-
23
-
24
-
25
-
26
-
27
-
28
-
29
-
30
-
31
-
32
-
33
-
34
-
35
-
36
-
37
-
38
-
39
-
40
-
41
-
42
-
43
-
44
-
45
-
46
-
47
-
48
-
49
-
50
-
51
-
52
-
53
-
54
-
55
-
56
-
57
-
58
-
59
-
60
-
61
-
62
-
63
-
64
-
65
-
66
-
67
-
68
-
69
-
70
-
71
-
72
-
73
-
74
-
75
-
76
-
77
-
78
-
79
-
80
 |
 |
BED BATH & BEYOND 2008 ANNUAL REPORT
5
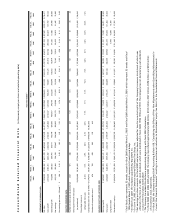
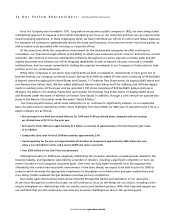
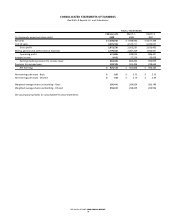
$6.069 billion of net sales. For fiscal 2008, the decrease in comparable store sales was approximately 2.4%. Net sales and comp
sales continued to be negatively affected by the economic slowdown including issues specific to the housing industry and the
liquidation sales of a number of retailers, including a significant competitor. For fiscal 2007, the increase in comparable store sales
was approximately 1.0%. This increase reflected the continued consumer acceptance of the Company’s merchandise offerings and
advertising programs, but was negatively affected by the economic slowdown, in general, and by issues specific to the housing
and mortgage industries in particular. In those areas of the Country that were reported to be the most significantly affected by
these issues, notably Arizona, California, Florida and Nevada, sales were noticeably weaker than in less affected areas.
Sales of domestics merchandise accounted for approximately 43%, 44% and 46% of net sales in fiscal 2008, 2007 and 2006,
respectively, of which the Company estimates that bed linens accounted for approximately 13%, 14% and 15% of net sales in
fiscal 2008, 2007 and 2006, respectively. The remaining net sales in fiscal 2008, 2007 and 2006 of 57%, 56% and 54%, respectively,
represented sales of home furnishings and other items. No other individual product category accounted for 10% or more of net
sales during fiscal 2008, 2007 or 2006.
Gross Profit
Gross profit in fiscal 2008, 2007 and 2006 was $2.873 billion or 39.9% of net sales, $2.925 billion or 41.5% of net sales and $2.835
billion or 42.8% of net sales, respectively. The decrease in gross profit between fiscal 2008 and 2007 as a percentage of net sales
was primarily due to an increase in inventory acquisition costs, an increase in coupon redemptions and the shift in the mix of mer-
chandise sold as the Company continues to experience a higher percentage of sales of home furnishings. The decrease in gross
profit between fiscal 2007 and 2006 as a percentage of net sales was primarily due to an increase in coupon redemptions associat-
ed with a heightened promotional environment, an increase in inventory acquisition costs and the shift in the mix of merchandise
sold, as the Company continued to experience a higher percentage of sales of home furnishings.
Selling, General and Administrative expenses
SG&A was $2.199 billion or 30.5% of net sales in fiscal 2008, $2.087 billion or 29.6% of net sales in fiscal 2007 and $1.946 billion or
29.4% of net sales in fiscal 2006. The increase in SG&A between fiscal 2008 and 2007 as a percentage of net sales is primarily due
to the 2.4% decline in comparable storesales, resulting in relative increases in occupancy costs (including rent, depreciation and
real estate taxes), as well as relative increases in payroll-related items (including salaries and benefits). Also contributing to the
increase in SG&A as a percentage of net sales were relative increases in advertising expenses, including increases in postage, paper
and other production costs. The increase in SG&A between fiscal 2007 and 2006 as a percentage of net sales was primarily due to
arelative increase in advertising expense as a result of increased distributions of advertising pieces in response to the heightened
promotional environment and a relative increase in occupancy costs and other expenses, partially offset by a relative decrease in
payroll and payroll related items (including a non-recurring pre-tax charge of $30 million in fiscal 2006 related to the Company’s
remediation program intended to protect its employees from certain adverse tax consequences arising pursuant to Internal
Revenue Code Section 409A).
Operating Profit
Operating profitfor fiscal 2008 was $673.9 million or 9.3% of net sales, $838.0 million or 11.9% of net sales in fiscal 2007 and
$889.4 million or 13.4% of net sales in fiscal 2006. The year over year decreases in operating profit as a percentage of net sales
were a result of changes in gross profit and SG&A, as discussed above.
Interest Income
Interest income in fiscal 2008, 2007 and 2006 was $9.4 million, $27.2 million and $43.5 million, respectively. Interest income
decreased in fiscal 2008 compared to fiscal 2007 primarily as a result of lower interest rates. Interest income decreased in fiscal
2007 compared to fiscal 2006 primarily as a result of lower cash balances principally due to share repurchase activity in fiscal 2007.
Income Taxes
The effective tax rate was 37.8% for fiscal 2008, 35.0% for fiscal 2007 and 36.3% for fiscal 2006. For fiscal 2008, the tax rate
included an approximate $0.8 million benefit primarily due to the recognition of certain discrete tax items and the changing of
the blended state tax rate of deferred income taxes. For fiscal 2007, the tax rate included an approximate $21.6 million benefit
primarily due to the effective settlement of certain discrete tax items from ongoing examinations, the recognition of favorable
discrete state tax items and from changing the blended state tax rate of deferred income taxes.
The Company expects that Financial Accounting Standards Board (“FASB”) Interpretation No. 48, “Accounting for Uncertainty in
Income Taxes–An Interpretation of FASB Statement No. 109” (“FIN 48”) will continue to create volatility in the effective tax rate
from year to year because the Company is required each year to determine whether new information changes the assessment of
both the probability that a tax position will effectively be sustained and the appropriateness of the amount of recognized benefit.