BP 2006 Annual Report Download - page 99
Download and view the complete annual report
Please find page 99 of the 2006 BP annual report below. You can navigate through the pages in the report by either clicking on the pages listed below, or by using the keyword search tool below to find specific information within the annual report.-
 1
1 -
2
-
3
-
4
-
5
-
6
-
7
-
8
-
9
-
10
-
11
-
12
-
13
-
14
-
15
-
16
-
17
-
18
-
19
-
20
-
21
-
22
-
23
-
24
-
25
-
26
-
27
-
28
-
29
-
30
-
31
-
32
-
33
-
34
-
35
-
36
-
37
-
38
-
39
-
40
-
41
-
42
-
43
-
44
-
45
-
46
-
47
-
48
-
49
-
50
-
51
-
52
-
53
-
54
-
55
-
56
-
57
-
58
-
59
-
60
-
61
-
62
-
63
-
64
-
65
-
66
-
67
-
68
-
69
-
70
-
71
-
72
-
73
-
74
-
75
-
76
-
77
-
78
-
79
-
80
-
81
-
82
-
83
-
84
-
85
-
86
-
87
-
88
-
 89
89 -
 90
90 -
 91
91 -
 92
92 -
 93
93 -
 94
94 -
 95
95 -
 96
96 -
 97
97 -
 98
98 -
 99
99 -
 100
100 -
 101
101 -
 102
102 -
 103
103 -
 104
104 -
 105
105 -
 106
106 -
 107
107 -
 108
108 -
 109
109 -
110
-
111
-
112
-
113
-
114
-
115
-
116
-
117
-
118
-
119
-
120
-
121
-
122
-
123
-
124
-
125
-
126
-
127
-
128
-
129
-
130
-
131
-
132
-
133
-
134
-
135
-
136
-
137
-
138
-
139
-
140
-
141
-
142
-
143
-
144
-
145
-
146
-
147
-
148
-
149
-
150
-
151
-
152
-
153
-
154
-
155
-
156
-
157
-
158
-
159
-
160
-
161
-
162
-
163
-
164
-
165
-
166
-
167
-
168
-
169
-
170
-
171
-
172
-
173
-
174
-
175
-
176
-
177
-
178
-
179
-
180
-
181
-
182
-
183
-
184
-
185
-
186
-
187
-
188
-
189
-
190
-
191
-
192
-
193
-
194
-
195
-
196
-
197
-
198
-
199
-
200
-
201
-
202
-
203
-
204
-
205
-
206
-
207
-
208
-
209
-
210
-
211
-
212
-
213
-
214
-
215
-
216
-
217
-
218
-
219
-
220
-
221
-
222
-
223
-
224
-
225
-
226
-
227
-
228
 |
 |

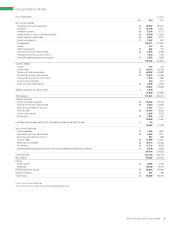
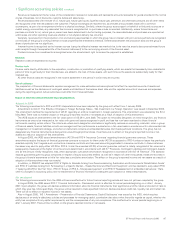
BP Annual Report and Accounts 2006 97
Group balance sheet
At 31 December $ million
------------------------------------------------------------------------------------------------------------------------------------------------------------------------------------------------------------------------------------------------------------------------------------------------------------
Note 2006 2005
------------------------------------------------------------------------------------------------------------------------------------------------------------------------------------------------------------------------------------------------------------------------------------------------------------
Non-current assets
Property, plant and equipment 26 90,999 85,947
Goodwill 27 10,780 10,371
Intangible assets 28 5,246 4,772
Investments in jointly controlled entities 29 15,074 13,556
Investments in associates 30 5,975 6,217
Other investments 31 1,697 967
------------------------------------------------------------------------------------------------------------------------------------------------------------------------------------------------------------------------------------------------------------------------------------------------------------
Fixed assets 129,771 121,830
Loans 817 821
Other receivables 33 862 770
Derivative financial instruments 36 3,025 3,909
Prepayments and accrued income 1,034 1,012
Defined benefit pension plan surplus 41 6,753 3,282
------------------------------------------------------------------------------------------------------------------------------------------------------------------------------------------------------------------------------------------------------------------------------------------------------------
142,262 131,624
Current assets
Loans 141 132
Inventories 32 18,915 19,760
Trade and other receivables 33 38,692 40,902
Derivative financial instruments 36 10,373 10,056
Prepayments and accrued income 3,006 1,268
Current tax receivable 544 212
Cash and cash equivalents 34 2,590 2,960
------------------------------------------------------------------------------------------------------------------------------------------------------------------------------------------------------------------------------------------------------------------------------------------------------------
74,261 75,290
Assets classified as held for sale 51,078 –
------------------------------------------------------------------------------------------------------------------------------------------------------------------------------------------------------------------------------------------------------------------------------------------------------------
75,339 75,290
------------------------------------------------------------------------------------------------------------------------------------------------------------------------------------------------------------------------------------------------------------------------------------------------------------
Total assets 217,601 206,914
Current liabilities
Trade and other payables 35 42,236 42,136
Derivative financial instruments 36 9,424 10,036
Accruals and deferred income 6,147 5,017
Finance debt 38 12,924 8,932
Current tax payable 2,635 4,274
Provisions 40 1,932 1,102
------------------------------------------------------------------------------------------------------------------------------------------------------------------------------------------------------------------------------------------------------------------------------------------------------------
75,298 71,497
Liabilities directly associated with the assets classified as held for sale 554 –
------------------------------------------------------------------------------------------------------------------------------------------------------------------------------------------------------------------------------------------------------------------------------------------------------------
75,352 71,497
------------------------------------------------------------------------------------------------------------------------------------------------------------------------------------------------------------------------------------------------------------------------------------------------------------
Non-current liabilities
Other payables 35 1,430 1,935
Derivative financial instruments 36 4,203 5,871
Accruals and deferred income 961 989
Finance debt 38 11,086 10,230
Deferred tax liabilities 23 18,116 16,443
Provisions 40 11,712 9,954
Defined benefit pension plan and other post-retirement benefit plan deficits 41 9,276 9,230
------------------------------------------------------------------------------------------------------------------------------------------------------------------------------------------------------------------------------------------------------------------------------------------------------------
56,784 54,652
------------------------------------------------------------------------------------------------------------------------------------------------------------------------------------------------------------------------------------------------------------------------------------------------------------
Total liabilities 132,136 126,149
------------------------------------------------------------------------------------------------------------------------------------------------------------------------------------------------------------------------------------------------------------------------------------------------------------
Net assets 85,465 80,765
Equity
Share capital 42 5,385 5,185
Reserves 79,239 74,791
------------------------------------------------------------------------------------------------------------------------------------------------------------------------------------------------------------------------------------------------------------------------------------------------------------
BP shareholders’ equity 43 84,624 79,976
Minority interest 43 841 789
------------------------------------------------------------------------------------------------------------------------------------------------------------------------------------------------------------------------------------------------------------------------------------------------------------
Total equity 43 85,465 80,765
Peter Sutherland Chairman
TheLordBrowneofMadingleyGroup Chief Executive