BP 2006 Annual Report Download - page 58
Download and view the complete annual report
Please find page 58 of the 2006 BP annual report below. You can navigate through the pages in the report by either clicking on the pages listed below, or by using the keyword search tool below to find specific information within the annual report.-
 1
1 -
2
-
3
-
4
-
5
-
6
-
7
-
8
-
9
-
10
-
11
-
12
-
13
-
14
-
15
-
16
-
17
-
18
-
19
-
20
-
21
-
22
-
23
-
24
-
25
-
26
-
27
-
28
-
29
-
30
-
31
-
32
-
33
-
34
-
35
-
36
-
37
-
38
-
39
-
40
-
41
-
42
-
43
-
44
-
45
-
46
-
47
-
 48
48 -
 49
49 -
 50
50 -
 51
51 -
 52
52 -
 53
53 -
 54
54 -
 55
55 -
 56
56 -
 57
57 -
 58
58 -
 59
59 -
 60
60 -
 61
61 -
 62
62 -
 63
63 -
 64
64 -
 65
65 -
 66
66 -
 67
67 -
 68
68 -
69
-
70
-
71
-
72
-
73
-
74
-
75
-
76
-
77
-
78
-
79
-
80
-
81
-
82
-
83
-
84
-
85
-
86
-
87
-
88
-
89
-
90
-
91
-
92
-
93
-
94
-
95
-
96
-
97
-
98
-
99
-
100
-
101
-
102
-
103
-
104
-
105
-
106
-
107
-
108
-
109
-
110
-
111
-
112
-
113
-
114
-
115
-
116
-
117
-
118
-
119
-
120
-
121
-
122
-
123
-
124
-
125
-
126
-
127
-
128
-
129
-
130
-
131
-
132
-
133
-
134
-
135
-
136
-
137
-
138
-
139
-
140
-
141
-
142
-
143
-
144
-
145
-
146
-
147
-
148
-
149
-
150
-
151
-
152
-
153
-
154
-
155
-
156
-
157
-
158
-
159
-
160
-
161
-
162
-
163
-
164
-
165
-
166
-
167
-
168
-
169
-
170
-
171
-
172
-
173
-
174
-
175
-
176
-
177
-
178
-
179
-
180
-
181
-
182
-
183
-
184
-
185
-
186
-
187
-
188
-
189
-
190
-
191
-
192
-
193
-
194
-
195
-
196
-
197
-
198
-
199
-
200
-
201
-
202
-
203
-
204
-
205
-
206
-
207
-
208
-
209
-
210
-
211
-
212
-
213
-
214
-
215
-
216
-
217
-
218
-
219
-
220
-
221
-
222
-
223
-
224
-
225
-
226
-
227
-
228
 |
 |

on page 13 and Risk factors on pages 12-13, which describe the risks and
uncertainties that may cause actual results and developments to differ
materially from those expressed or implied by these forward-looking
statements. The company provides no commitment to update the
forward-looking statements or to publish financial projections for forward-
looking statements in the future.
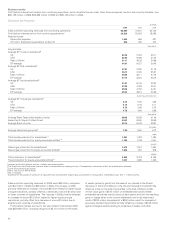
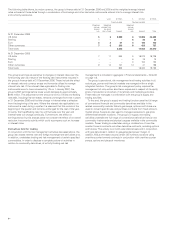
Financing the group’s activities
The group’s principal commodity, oil, is priced internationally in US dollars.
Group policy has been to minimize economic exposure to currency
movements by financing operations with US dollar debt wherever
possible, otherwise by using currency swaps when funds have been
raised in currencies other than US dollars.
The group’s finance debt is almost entirely in US dollars and at
31 December 2006 amounted to $24,010 million (2005 $19,162 million)
of which $12,924 million (2005 $8,932 million) was short term.
Net debt was $21,420 million at the end of 2006, an increase of
$5,218 million compared with 2005. The ratio of net debt to net debt plus
equity was 20% at the end of 2006 and 17% at the end of 2005. The ratio
of 20% at 31 December 2006 takes into account seasonal impacts.
The maturity profile and fixed/floating rate characteristics of the group’s
debt are described in Financial statements – Note 38 on page 149.
We have in place a European Debt Issuance Programme (DIP) under
which the group may raise $10 billion of debt for maturities of one month
or longer. At 31 December 2006, the amount drawn down against the DIP
was $7,893 million.
In addition, the group has in place a US Shelf Registration under which
it may raise $10 billion of debt with maturities of one month or longer. At
31 December there had not been any draw-down.
Commercial paper markets in the US and Europe are a primary source
of liquidity for the group. At 31 December 2006, the outstanding
commercial paper amounted to $4,167 million (2005 $1,911million).
The group also has access to significant sources of liquidity in the form
of committed facilities and other funding through the capital markets. At
31 December 2006, the group had available undrawn committed
borrowing facilities of $4,700 million ($4,500 million at 31 December
2005).
BP believes that, taking into account the substantial amounts of
undrawn borrowing facilities available, the group has sufficient working
capital for foreseeable requirements.
In addition to reported debt, BP uses conventional off balance sheet
arrangements such as operating leases and borrowings in jointly
controlled entities and associates. At 31 December 2006, the group’s
share of third-party finance debt of jointly controlled entities and
associates was $4,942 million (2005 $3,266 million) and $1,143 million
(2005 $970 million) respectively. These amounts are not reflected in the
group’s debt on the balance sheet.
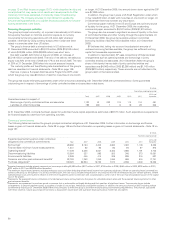
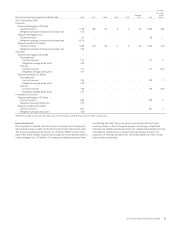
The group has issued third-party guarantees under which amounts outstanding at 31 December 2006 are summarized below. Some guarantees
outstanding are in respect of borrowings of jointly controlled entities and associates noted above.
$million
------------------------------------------------------------------------------------------------------------------------------------------------------------------------------------------------------------------------------------------------------------------------------------------------------------
Guarantees expiring by period
------------------------------------------------------------------------------------------------------------------------------------------------------------------------------------------------------------------------------------------------------------------------------------------------------------
Total 2007 2008 2009 2010 2011
2012 and
thereafter
------------------------------------------------------------------------------------------------------------------------------------------------------------------------------------------------------------------------------------------------------------------------------------------------------------
Guarantees issued in respect of
Borrowings of jointly controlled entities and associates 1,123 91 223 118 114 116 461
Liabilities of other third parties 789 480 7 8 19 29 246
At 31 December 2006, contracts had been placed for authorized future capital expenditure estimated at $9,773 million. Such expenditure is expected to
be financed largely by cash flow from operating activities.
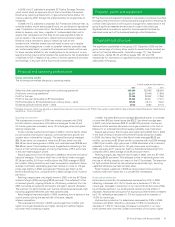
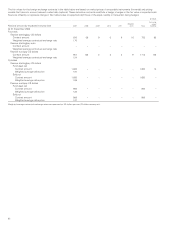
Contractual commitments
The following table summarizes the group’s principal contractual obligations at 31 December 2006. Further information on borrowings and finance
leases is given in Financial statements – Note 38 on page 149 and further information on operating leases is given in Financial statements – Note 18 on
page 127.
$million
------------------------------------------------------------------------------------------------------------------------------------------------------------------------------------------------------------------------------------------------------------------------------------------------------------
Payments due by period
------------------------------------------------------------------------------------------------------------------------------------------------------------------------------------------------------------------------------------------------------------------------------------------------------------
Expected payments by period under contractual
obligations and commercial commitments Total 2007 2008 2009 2010 2011
2012 and
thereafter
------------------------------------------------------------------------------------------------------------------------------------------------------------------------------------------------------------------------------------------------------------------------------------------------------------
Borrowingsa28,680 9,164 4,403 4,663 1,022 1,106 8,322
Finance lease minimum future lease payments 1,331 82 92 93 94 97 873
Operating leasesb17,408 3,355 3,031 2,403 1,686 1,191 5,742
Decommissioning liabilities 12,064 337 292 255 346 273 10,561
Environmental liabilities 2,298 445 414 309 288 215 627
Pensions and other post-retirement benefitsc22,793 1,353 1,350 1,066 668 615 17,741
Purchase obligationsd139,020 86,954 16,723 7,573 4,948 4,500 18,322
aExpected payments include interest payments on borrowings totalling $5,485 million ($917 million in 2007, $750 million in 2008, $554 million in 2009, $335 million in 2010,
$301 million in 2011 and $2,628 million thereafter).
bThe minimum future lease payments including executory costs and after deducting related rental income from operating subleases. Where an operating lease is entered into
solely by the group as the operator of a jointly controlled asset, the total cost is included irrespective of any amounts that will be reimbursed by joint venture partners. Where
operating lease costs are incurred in relation to the hire of equipment used in connection with a capital project, some or all of the cost may be capitalized as part of the capital
cost of the project.
cRepresents the expected future contributions to funded pension plans and payments by the group for unfunded pension plans and the expected future payments for other
post-retirement benefits.
dRepresents any agreement to purchase goods or services that is enforceable and legally binding and that specifies all significant terms. The amounts shown include
arrangements to secure long-term access to supplies of crude oil, natural gas, feedstocks and pipeline systems. In addition, the amounts shown for 2007 include purchase
commitments existing at 31 December 2006 entered into principally to meet the group’s short-term manufacturing and marketing requirements. The price risk associated
with these crude oil, natural gas and power contracts is discussed in Quantitative and qualitative disclosures about market risk on page 61.
56