BP 2006 Annual Report Download - page 13
Download and view the complete annual report
Please find page 13 of the 2006 BP annual report below. You can navigate through the pages in the report by either clicking on the pages listed below, or by using the keyword search tool below to find specific information within the annual report.-
 1
1 -
2
-
 3
3 -
 4
4 -
 5
5 -
 6
6 -
 7
7 -
 8
8 -
 9
9 -
 10
10 -
 11
11 -
 12
12 -
 13
13 -
 14
14 -
 15
15 -
 16
16 -
 17
17 -
 18
18 -
 19
19 -
 20
20 -
 21
21 -
 22
22 -
 23
23 -
24
-
25
-
26
-
27
-
28
-
29
-
30
-
31
-
32
-
33
-
34
-
35
-
36
-
37
-
38
-
39
-
40
-
41
-
42
-
43
-
44
-
45
-
46
-
47
-
48
-
49
-
50
-
51
-
52
-
53
-
54
-
55
-
56
-
57
-
58
-
59
-
60
-
61
-
62
-
63
-
64
-
65
-
66
-
67
-
68
-
69
-
70
-
71
-
72
-
73
-
74
-
75
-
76
-
77
-
78
-
79
-
80
-
81
-
82
-
83
-
84
-
85
-
86
-
87
-
88
-
89
-
90
-
91
-
92
-
93
-
94
-
95
-
96
-
97
-
98
-
99
-
100
-
101
-
102
-
103
-
104
-
105
-
106
-
107
-
108
-
109
-
110
-
111
-
112
-
113
-
114
-
115
-
116
-
117
-
118
-
119
-
120
-
121
-
122
-
123
-
124
-
125
-
126
-
127
-
128
-
129
-
130
-
131
-
132
-
133
-
134
-
135
-
136
-
137
-
138
-
139
-
140
-
141
-
142
-
143
-
144
-
145
-
146
-
147
-
148
-
149
-
150
-
151
-
152
-
153
-
154
-
155
-
156
-
157
-
158
-
159
-
160
-
161
-
162
-
163
-
164
-
165
-
166
-
167
-
168
-
169
-
170
-
171
-
172
-
173
-
174
-
175
-
176
-
177
-
178
-
179
-
180
-
181
-
182
-
183
-
184
-
185
-
186
-
187
-
188
-
189
-
190
-
191
-
192
-
193
-
194
-
195
-
196
-
197
-
198
-
199
-
200
-
201
-
202
-
203
-
204
-
205
-
206
-
207
-
208
-
209
-
210
-
211
-
212
-
213
-
214
-
215
-
216
-
217
-
218
-
219
-
220
-
221
-
222
-
223
-
224
-
225
-
226
-
227
-
228
 |
 |

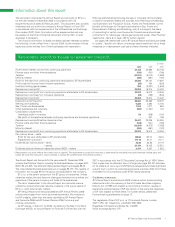
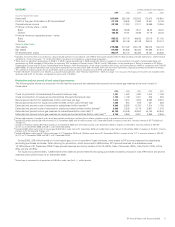
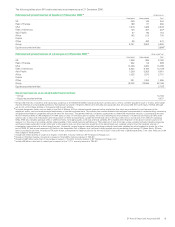
US GAAP $ million except per share amounts
------------------------------------------------------------------------------------------------------------------------------------------------------------------------------------------------------------------------------------------------------------------------------------------------------------
2006 2005 2004 2003 2002
------------------------------------------------------------------------------------------------------------------------------------------------------------------------------------------------------------------------------------------------------------------------------------------------------------
Income statement data
Revenuesd265,906 252,168 203,303 173,615 145,991
Profit for the year attributable to BP shareholdersd21,116 19,642 17,090 12,941 8,109
Comprehensive income 23,125 17,053 17,371 19,689 10,256
Profit per ordinary share – cents
Basic 105.42 92.96 78.31 58.36 36.20
Diluted 104.63 91.91 76.88 57.79 36.02
Profit per American depositary share – cents
Basic 632.52 557.76 469.86 350.16 217.20
Diluted 627.78 551.46 461.28 346.74 216.12
Balance sheet data
Total assets 219,288 213,722 206,139 186,576 164,103
Net assets 87,358 85,936 86,435 80,292 67,274
BP shareholders’ equity 86,517 85,147 85,092 79,167 66,636
aExcludes Innovene which was treated as a discontinued operation in accordance with IFRS 5 ‘Non-current Assets Held for Sale and Discontinued Operations’. (See Financial
statements – Note 5 on page 111). Under US GAAP, Innovene is not treated as a discontinued operation.
bThere were no significant acquisitions in 2006 or in 2005. Capital expenditure in 2006 includes $1 billion in respect of our investment in Rosneft. Capital expenditure and
acquisitions for 2004 includes $1,354 million for including TNK’s interest in Slavneft within TNK-BP and $1,355 million for the acquisition of Solvay’s interests in BP Solvay
Polyethylene Europe and BP Solvay Polyethylene North America. With the exception of the shares issued to Alfa Group and Access-Renova (AAR) in connection with TNK-BP
(2004-2006), all capital expenditure and acquisitions during the last five years have been financed from cash flow from operations, disposal proceeds and external financing.
cThe number of ordinary shares shown have been used to calculate per share amounts for both IFRS and US GAAP.
dUnder US GAAP, Innovene is not treated as a discontinued operation. (See Financial statements – Note 5 on page 111). As such, the results of Innovene are included within
revenues and profit for the year, as adjusted to accord with US GAAP.
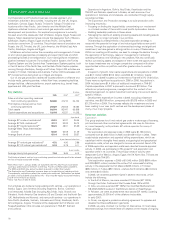
Production and net proved oil and natural gas reserves
The following table shows our production for the last five years and the estimated net proved oil and natural gas reserves at the end of each of
those years.
------------------------------------------------------------------------------------------------------------------------------------------------------------------------------------------------------------------------------------------------------------------------------------------------------------
2006 2005 2004 2003 2002
------------------------------------------------------------------------------------------------------------------------------------------------------------------------------------------------------------------------------------------------------------------------------------------------------------
Crude oil production for subsidiaries (thousand barrels per day) 1,351 1,423 1,480 1,615 1,766
Crude oil production for equity-accounted entities (thousand barrels per day) 1,124 1,139 1,051 506 252
Natural gas production for subsidiaries (million cubic feet per day) 7,412 7,512 7,624 8,092 8,324
Natural gas production for equity-accounted entities (million cubic feet per day) 1,005 912 879 521 383
Estimated net proved crude oil reserves for subsidiaries (million barrels)ab 5,893 6,360 6,755 7,214 7,762
Estimated net proved crude oil reserves for equity-accounted entities (million barrels)ac 3,888 3,205 3,179 2,867 1,403
Estimated net proved natural gas reserves for subsidiaries (billion cubic feet)ad 42,168 44,448 45,650 45,155 45,844
Estimated net proved natural gas reserves for equity-accounted entities (billion cubic feet)ae 3,763 3,856 2,857 2,869 2,945
aNet proved reserves of crude oil and natural gas exclude production royalties due to others, whether royalty is payable in cash or in kind.
bIncludes 23 million barrels (29 million barrels at 31 December 2005 and 40 million barrels at 31 December 2004) in respect of the 30% minority interest in BP Trinidad and
Tobago LLC.
cIncludes 179 million barrels (95 million barrels at 31 December 2005 and 127 million barrels at 31 December 2004) in respect of the 6.29% minority interest in TNK-BP
(4.47% at 31 December 2005 and 5.9% at 31 December 2004).
dIncludes 3,537 billion cubic feet of natural gas (3,812 billion cubic feet at 31 December 2005 and 4,064 billion cubic feet at 31 December 2004) in respect of the 30% minority
interest in BP Trinidad and Tobago LLC.
eIncludes 99 billion cubic feet (57 billion cubic feet at 31 December 2005 and 13 billion cubic feet at 31 December 2004) in respect of the 7.77% minority interest in TNK-BP
(4.47% at 31 December 2005 and 5.9% at 31 December 2004).
During 2006, 329 million barrels of oil and natural gas, on an oil equivalent* basis (mmboe), were added to BP’s proved reserves for subsidiaries
(excluding purchases and sales). After allowing for production, which amounted to 963mmboe, BP’s proved reserves for subsidiaries were
13,163mmboe at 31 December 2006. These proved reserves are mainly located in the US (44%), Rest of Americas (20%), Asia Pacific (10%), Africa
(9%) and the UK (8%).
For equity-accounted entities, 1,306mmboe were added to proved reserves (excluding purchases and sales), production was 479mmboe and proved
reserves were 4,537mmboe at 31 December 2006.
*Natural gas is converted to oil equivalent at 5.8 billion cubic feet (bcf) = 1 million barrels.
BP Annual Report and Accounts 2006 11