BP 2006 Annual Report Download - page 33
Download and view the complete annual report
Please find page 33 of the 2006 BP annual report below. You can navigate through the pages in the report by either clicking on the pages listed below, or by using the keyword search tool below to find specific information within the annual report.-
 1
1 -
2
-
3
-
4
-
5
-
6
-
7
-
8
-
9
-
10
-
11
-
12
-
13
-
14
-
15
-
16
-
17
-
18
-
19
-
20
-
21
-
22
-
 23
23 -
 24
24 -
 25
25 -
 26
26 -
 27
27 -
 28
28 -
 29
29 -
 30
30 -
 31
31 -
 32
32 -
 33
33 -
 34
34 -
 35
35 -
 36
36 -
 37
37 -
 38
38 -
 39
39 -
 40
40 -
 41
41 -
 42
42 -
 43
43 -
44
-
45
-
46
-
47
-
48
-
49
-
50
-
51
-
52
-
53
-
54
-
55
-
56
-
57
-
58
-
59
-
60
-
61
-
62
-
63
-
64
-
65
-
66
-
67
-
68
-
69
-
70
-
71
-
72
-
73
-
74
-
75
-
76
-
77
-
78
-
79
-
80
-
81
-
82
-
83
-
84
-
85
-
86
-
87
-
88
-
89
-
90
-
91
-
92
-
93
-
94
-
95
-
96
-
97
-
98
-
99
-
100
-
101
-
102
-
103
-
104
-
105
-
106
-
107
-
108
-
109
-
110
-
111
-
112
-
113
-
114
-
115
-
116
-
117
-
118
-
119
-
120
-
121
-
122
-
123
-
124
-
125
-
126
-
127
-
128
-
129
-
130
-
131
-
132
-
133
-
134
-
135
-
136
-
137
-
138
-
139
-
140
-
141
-
142
-
143
-
144
-
145
-
146
-
147
-
148
-
149
-
150
-
151
-
152
-
153
-
154
-
155
-
156
-
157
-
158
-
159
-
160
-
161
-
162
-
163
-
164
-
165
-
166
-
167
-
168
-
169
-
170
-
171
-
172
-
173
-
174
-
175
-
176
-
177
-
178
-
179
-
180
-
181
-
182
-
183
-
184
-
185
-
186
-
187
-
188
-
189
-
190
-
191
-
192
-
193
-
194
-
195
-
196
-
197
-
198
-
199
-
200
-
201
-
202
-
203
-
204
-
205
-
206
-
207
-
208
-
209
-
210
-
211
-
212
-
213
-
214
-
215
-
216
-
217
-
218
-
219
-
220
-
221
-
222
-
223
-
224
-
225
-
226
-
227
-
228
 |
 |

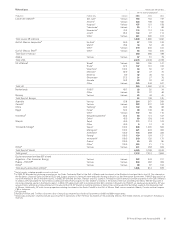
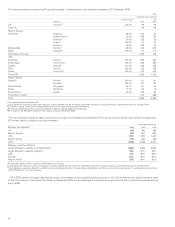
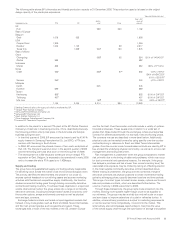
Marketing
Marketing comprises four business areas: Retail, Lubricants, Business-
to-Business Marketing and Aromatics and Acetyls. We market a
comprehensive range of refined products, including gasoline, gasoil,
marine and aviation fuels, heating fuels, LPG, lubricants and bitumen.
We also manufacture and market purified terephthalic acid, paraxylene
and acetic acid through our Aromatics and Acetyls business.
thousand barrels per day
--------------------------------------------------------------------------------------------------------------------------------------------------
Sales of refined productsa2006 2005 2004
--------------------------------------------------------------------------------------------------------------------------------------------------
Marketing sales
UKb356 355 322
Rest of Europe 1,340 1,354 1,360
USA 1,595 1,634 1,682
Rest of World 581 599 638
--------------------------------------------------------------------------------------------------------------------------------------------------
Total marketing salesc3,872 3,942 4,002
Trading/supply salesd1,929 1,946 2,396
--------------------------------------------------------------------------------------------------------------------------------------------------
Total refined products 5,801 5,888 6,398
$million
--------------------------------------------------------------------------------------------------------------------------------------------------
Proceeds from sale of refined
products 177,995 155,098 124,458
aExcludes sales to other BP businesses and the sale of Aromatics and Acetyls
products.
bUK area includes the UK-based international activities of Refining and Marketing.
cMarketing sales are sales to service stations, end-consumers, bulk buyers and
jobbers (i.e. third parties who own networks of a number of service stations and
small resellers).
dTrading/supply sales are sales to large unbranded resellers and other oil companies.
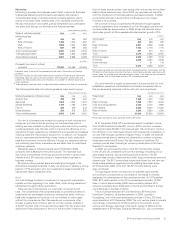
The following table sets out marketing sales by major product group.
thousand barrels per day
--------------------------------------------------------------------------------------------------------------------------------------------------
Marketing sales by refined product 2006 2005 2004
--------------------------------------------------------------------------------------------------------------------------------------------------
Aviation fuel 488 499 494
Gasolines 1,603 1,603 1,675
Middle distillates 1,170 1,185 1,255
Fuel oil 388 379 343
Other products 223 276 235
--------------------------------------------------------------------------------------------------------------------------------------------------
Total marketing sales 3,872 3,942 4,002
Our aim is to increase total margin by focusing on both volumes and
margin per unit. We do this by growing our customer base, both in
existing and new markets, by attracting new customers and by covering
a wider geographic area. We also work to improve the efficiency of our
operations through upgrading our transactional and operational processes,
reducing costs and improving our product mix. In addition, we recognize
that our customers are demanding a wider choice of fuels, particularly
fuels that are cleaner and more efficient. Through our integrated refining
and marketing operations, we believe we are better able to meet these
customer demands.
Marketing sales of refined products were 3,872mb/d in 2006,
compared with 3,942mb/d in the previous year. The decrease was
due mainly to the effects of the high price environment in certain retail
markets and of BP reducing volumes in less profitable business-to-
business markets.
BP enjoys a strong market share and leading technologies in the
Aromatics and Acetyls business. In Asia, we continue to develop a strong
position in PTA and acetic acid. Our investment is biased towards this
high-growth region, especially China.
Retail
Our retail strategy focuses on investment in high-growth metropolitan
markets and the upgrading of our retail offers, while driving operational
efficiencies through portfolio optimization.
There are two components of our retail offer: convenience and
fuels. The convenience offer comprises sales of convenience items to
customers from advantaged locations in metropolitan areas, while our
fuels offer is deployed at locations in all our markets, in many cases
without the convenience offer. We execute our convenience offer
through a quality store format in each of our key markets, whether it
is the BP Connect offer in Europe and the eastern US, the am/pm offer
west of the Rocky Mountains in the US or the Aral offer in Germany.
Each of these brands carries a very strong offer and we also aim to share
best practices between them. Since 2003, we upgraded our fuel offer
with the introduction of Ultimate gasoline and diesel products. In 2006,
we launched Utimate in South Africa and Russia and now market
Ultimate in 15 countries.
We continue to focus on operational efficiencies through targeted
portfolio upgrades to drive increases in our fuel throughput per site and
our store sales per square metre. In 2006, across the network, same-
store sales growth at 4% exceeded estimated market growth of 2%.
$ million
--------------------------------------------------------------------------------------------------------------------------------------------------
Store salesa2006 2005 2004
--------------------------------------------------------------------------------------------------------------------------------------------------
UK 647 628 655
Rest of Europe 2,821 3,069 3,090
USA 1,755 1,776 1,715
Rest of World 591 610 601
--------------------------------------------------------------------------------------------------------------------------------------------------
Total 5,814 6,083 6,061
Direct-managed 2,528 2,489 2,319
Franchise 3,286 3,533 3,623
Store alliances –61 119
--------------------------------------------------------------------------------------------------------------------------------------------------
Total 5,814 6,083 6,061
aStore sales reported are sales through direct-managed stations, franchisees and the
BP share of store alliances and joint ventures. Sales figures exclude sales taxes and
lottery sales but include quick-service restaurant sales. Fuel sales are not included in
these figures. Not all retail sites include a BP convenience store.
Our retail network is largely concentrated in Europe and the US, with
established operations in Australasia and southern and eastern Africa.
We are developing networks in China with joint venture partners.
Number of retail sites
--------------------------------------------------------------------------------------------------------------------------------------------------
Retail sitesa2006 2005 2004
--------------------------------------------------------------------------------------------------------------------------------------------------
UK 1,300 1,300 1,300
Rest of Europe 7,700 7,900 8,000
USA (excluding jobbers) 2,700 3,100 3,900
USA jobbers 9,600 9,700 10,300
Rest of World 3,300 3,200 3,300
--------------------------------------------------------------------------------------------------------------------------------------------------
Total 24,600 25,200 26,800
aRetail sites includes all sites operated under a BP brand.
At 31 December 2006, BP’s worldwide network consisted of more
than 24,000 locations branded BP, Amoco, ARCO and Aral, compared
with approximately 25,000 in the previous year. We continue to improve
the efficiency of our retail asset network and increase the consistency of
our site offer through a process of regular review. In 2006, we sold 513
company-owned sites to dealers and jobbers who continue to operate
these sites under the BP brand. We also divested an additional 301
company-owned sites (including all company-owned sites in the Czech
Republic) to third parties.
In 2006, we continued the rollout of the BP Connect offer at sites
in the UK and US, consistent with our retail strategy of building on our
advantaged locations, strong market positions and brand. The BP
Connect sites include a distinctive food offer, large convenience store and
cleaner fuels. The BP Connect sites include both those that are new and
those where extensive upgrading and remodelling have taken place.
At 31 December 2006, more than 760 BP Connect stations were
open worldwide.
Through regular review and execution of business opportunities,
we continue to concentrate our ownership of real estate in markets
designated for development of the convenience offer. At 31 December
2006, BP’s retail network in the US comprised approximately 12,300
sites, of which approximately 9,600 were owned by jobbers. BP’s
network comprised about 9,000 sites in the UK and the Rest of Europe
and 3,300 sites in the Rest of World.
The joint venture between BP and PetroChina (BP-PetroChina
Petroleum Company Ltd) started operation in 2004. Located in
Guangdong, one of the most developed provinces in China, 387 sites
were operational at 31 December 2006. The joint venture plans to operate
and manage a total network of 500 locations in the province. A joint
venture with Sinopec, approved in the fourth quarter of 2004 with the
establishment of BP-Sinopec (Zhejiang) Petroleum Co. Ltd, commenced
BP Annual Report and Accounts 2006 31