BP 2006 Annual Report Download - page 217
Download and view the complete annual report
Please find page 217 of the 2006 BP annual report below. You can navigate through the pages in the report by either clicking on the pages listed below, or by using the keyword search tool below to find specific information within the annual report.-
 1
1 -
2
-
3
-
4
-
5
-
6
-
7
-
8
-
9
-
10
-
11
-
12
-
13
-
14
-
15
-
16
-
17
-
18
-
19
-
20
-
21
-
22
-
23
-
24
-
25
-
26
-
27
-
28
-
29
-
30
-
31
-
32
-
33
-
34
-
35
-
36
-
37
-
38
-
39
-
40
-
41
-
42
-
43
-
44
-
45
-
46
-
47
-
48
-
49
-
50
-
51
-
52
-
53
-
54
-
55
-
56
-
57
-
58
-
59
-
60
-
61
-
62
-
63
-
64
-
65
-
66
-
67
-
68
-
69
-
70
-
71
-
72
-
73
-
74
-
75
-
76
-
77
-
78
-
79
-
80
-
81
-
82
-
83
-
84
-
85
-
86
-
87
-
88
-
89
-
90
-
91
-
92
-
93
-
94
-
95
-
96
-
97
-
98
-
99
-
100
-
101
-
102
-
103
-
104
-
105
-
106
-
107
-
108
-
109
-
110
-
111
-
112
-
113
-
114
-
115
-
116
-
117
-
118
-
119
-
120
-
121
-
122
-
123
-
124
-
125
-
126
-
127
-
128
-
129
-
130
-
131
-
132
-
133
-
134
-
135
-
136
-
137
-
138
-
139
-
140
-
141
-
142
-
143
-
144
-
145
-
146
-
147
-
148
-
149
-
150
-
151
-
152
-
153
-
154
-
155
-
156
-
157
-
158
-
159
-
160
-
161
-
162
-
163
-
164
-
165
-
166
-
167
-
168
-
169
-
170
-
171
-
172
-
173
-
174
-
175
-
176
-
177
-
178
-
179
-
180
-
181
-
182
-
183
-
184
-
185
-
186
-
187
-
188
-
189
-
190
-
191
-
192
-
193
-
194
-
195
-
196
-
197
-
198
-
199
-
200
-
201
-
202
-
203
-
204
-
205
-
206
-
 207
207 -
 208
208 -
 209
209 -
 210
210 -
 211
211 -
 212
212 -
 213
213 -
 214
214 -
 215
215 -
 216
216 -
 217
217 -
 218
218 -
 219
219 -
 220
220 -
 221
221 -
 222
222 -
 223
223 -
 224
224 -
 225
225 -
 226
226 -
 227
227 -
228
 |
 |

BP Annual Report and Accounts 2006 215
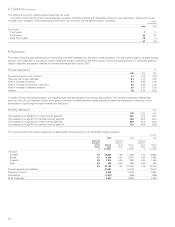
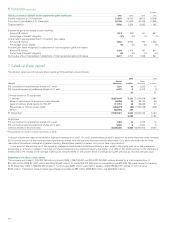
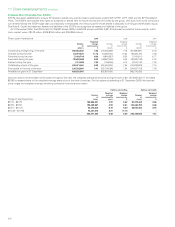
8 Capital and reserves
$ million
------------------------------------------------------------------------------------------------------------------------------------------------------------------------------------------------------------------------------------------------------------------------------------------------------------
Share
capital
Share
premium
account
Capital
redemption
reserve
Merger
reserve
Other
reserves
Own
shares
Treasury
shares
Share-based
payment
reserve
Profit
and loss
account Total
------------------------------------------------------------------------------------------------------------------------------------------------------------------------------------------------------------------------------------------------------------------------------------------------------------
At 1 January 2006 5,185 7,371 749 26,493 16 (140) (10,598) 599 58,661 88,336
Currency translation differences –––––(19)–––(19)
Actuarial gain on pensions (net of tax) ––––––––785785
Issue of ordinary share capital for TNK-BP 28 1,222 – – – – – – – 1,250
Repurchase of ordinary share capital (90) – 90 – – – (11,472) – (4,009) (15,481)
Share-based payments (net of tax) 16 481 – 11 (11) 5 134 190 (79) 747
Profit for the year ––––––––24,18624,186
Dividends – – – – – – – – (7,686) (7,686)
Othera246 – – – – – (246) – – –
------------------------------------------------------------------------------------------------------------------------------------------------------------------------------------------------------------------------------------------------------------------------------------------------------------
At 31 December 2006 5,385 9,074 839 26,504 5 (154) (22,182) 789 71,858 92,118
aReclassification in respect of share repurchases in 2005.
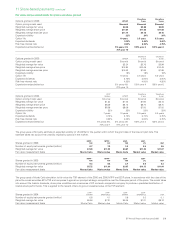
$ million
------------------------------------------------------------------------------------------------------------------------------------------------------------------------------------------------------------------------------------------------------------------------------------------------------------
Share
capital
Share
premium
account
Capital
redemption
reserve
Merger
reserve
Other
reserves
Own
shares
Treasury
shares
Share-based
payment
reserve
Profit
and loss
account Total
------------------------------------------------------------------------------------------------------------------------------------------------------------------------------------------------------------------------------------------------------------------------------------------------------------
At 1 January 2005 5,403 5,636 730 26,465 44 (82) – 399 45,062 83,657
Currency translation differences –––––12–––12
Actuarial gain on pensions (net of tax) ––––––––811811
Issue of ordinary share capital for TNK-BP 27 1,223 – – – – – – – 1,250
Repurchase of ordinary share capital (265) – 19 – – – (10,601) – (750) (11,597)
Share-based payments 20 512 – 28 (28) (70) 3 200 39 704
Profit for the year – – – – – – – – 20,858 20,858
Dividends – – – – – – – – (7,359) (7,359)
------------------------------------------------------------------------------------------------------------------------------------------------------------------------------------------------------------------------------------------------------------------------------------------------------------
At 31 December 2005 5,185 7,371 749 26,493 16 (140) (10,598) 599 58,661 88,336
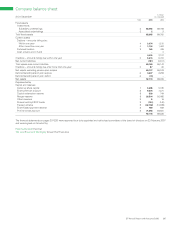
As a consolidated income statement is presented for the group, a separate income statement for the parent company is not required to be published.
The profit and loss account reserve includes $26,668 million (2005 $27,391 million and 2004 $25,026 million), the distribution of which is limited by
statutory or other restrictions.
The company does not account for dividends until they have been paid. The accounts for the year ended 31 December 2006 do not reflect
the dividend announced on 6 February 2007 and payable in March 2007; this will be treated as an appropriation of profit in the year ended
31 December 2007.
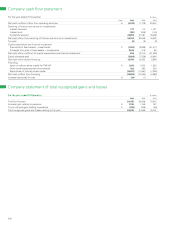
9Cashflow
Reconciliation of net cash flow to movement in net debt $ million
------------------------------------------------------------------------------------------------------------------------------------------------------------------------------------------------------------------------------------------------------------------------------------------------------------
2006 2005 2004
------------------------------------------------------------------------------------------------------------------------------------------------------------------------------------------------------------------------------------------------------------------------------------------------------------
Increase (decrease) in cash (24) (1) 1
------------------------------------------------------------------------------------------------------------------------------------------------------------------------------------------------------------------------------------------------------------------------------------------------------------
Movement in net debt (24) (1) 1
Net debt at 1 January 343
------------------------------------------------------------------------------------------------------------------------------------------------------------------------------------------------------------------------------------------------------------------------------------------------------------
Net debt at 31 December (21) 34
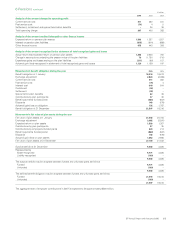
Notes on cash flow statement $ million
------------------------------------------------------------------------------------------------------------------------------------------------------------------------------------------------------------------------------------------------------------------------------------------------------------
(a) Reconciliation of operating profit to net cash (outflow) inflow from operating activities 2006 2005 2004
------------------------------------------------------------------------------------------------------------------------------------------------------------------------------------------------------------------------------------------------------------------------------------------------------------
Operating profit 24,768 20,674 18,313
Depreciation and amounts provided ––12
Net operating charge for pensions and other post-retirement benefits, less contributions (83) 186 168
Dividends, interest and other income (25,036) (21,197) (19,626)
Share-based payments 325 278 224
(Increase) decrease in debtors (2,140) (368) 22,374
Increase (decrease) in creditors (1,537) (681) 2,448
------------------------------------------------------------------------------------------------------------------------------------------------------------------------------------------------------------------------------------------------------------------------------------------------------------
Net cash (outflow) inflow from operating activities (3,703) (1,108) 23,913
(b) Analysis of net debt $ million
------------------------------------------------------------------------------------------------------------------------------------------------------------------------------------------------------------------------------------------------------------------------------------------------------------
At
1January
2006
Cash
flow
At 31
December
2006
------------------------------------------------------------------------------------------------------------------------------------------------------------------------------------------------------------------------------------------------------------------------------------------------------------
Cash at bank 3 (3) –
Bank overdrafts – (21) (21)
------------------------------------------------------------------------------------------------------------------------------------------------------------------------------------------------------------------------------------------------------------------------------------------------------------
3 (24) (21)