BP 2006 Annual Report Download - page 119
Download and view the complete annual report
Please find page 119 of the 2006 BP annual report below. You can navigate through the pages in the report by either clicking on the pages listed below, or by using the keyword search tool below to find specific information within the annual report.-
 1
1 -
2
-
3
-
4
-
5
-
6
-
7
-
8
-
9
-
10
-
11
-
12
-
13
-
14
-
15
-
16
-
17
-
18
-
19
-
20
-
21
-
22
-
23
-
24
-
25
-
26
-
27
-
28
-
29
-
30
-
31
-
32
-
33
-
34
-
35
-
36
-
37
-
38
-
39
-
40
-
41
-
42
-
43
-
44
-
45
-
46
-
47
-
48
-
49
-
50
-
51
-
52
-
53
-
54
-
55
-
56
-
57
-
58
-
59
-
60
-
61
-
62
-
63
-
64
-
65
-
66
-
67
-
68
-
69
-
70
-
71
-
72
-
73
-
74
-
75
-
76
-
77
-
78
-
79
-
80
-
81
-
82
-
83
-
84
-
85
-
86
-
87
-
88
-
89
-
90
-
91
-
92
-
93
-
94
-
95
-
96
-
97
-
98
-
99
-
100
-
101
-
102
-
103
-
104
-
105
-
106
-
107
-
108
-
 109
109 -
 110
110 -
 111
111 -
 112
112 -
 113
113 -
 114
114 -
 115
115 -
 116
116 -
 117
117 -
 118
118 -
 119
119 -
 120
120 -
 121
121 -
 122
122 -
 123
123 -
 124
124 -
 125
125 -
 126
126 -
 127
127 -
 128
128 -
 129
129 -
130
-
131
-
132
-
133
-
134
-
135
-
136
-
137
-
138
-
139
-
140
-
141
-
142
-
143
-
144
-
145
-
146
-
147
-
148
-
149
-
150
-
151
-
152
-
153
-
154
-
155
-
156
-
157
-
158
-
159
-
160
-
161
-
162
-
163
-
164
-
165
-
166
-
167
-
168
-
169
-
170
-
171
-
172
-
173
-
174
-
175
-
176
-
177
-
178
-
179
-
180
-
181
-
182
-
183
-
184
-
185
-
186
-
187
-
188
-
189
-
190
-
191
-
192
-
193
-
194
-
195
-
196
-
197
-
198
-
199
-
200
-
201
-
202
-
203
-
204
-
205
-
206
-
207
-
208
-
209
-
210
-
211
-
212
-
213
-
214
-
215
-
216
-
217
-
218
-
219
-
220
-
221
-
222
-
223
-
224
-
225
-
226
-
227
-
228
 |
 |

BP Annual Report and Accounts 2006 117
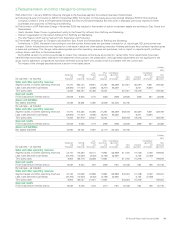
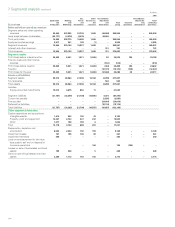
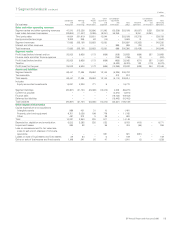
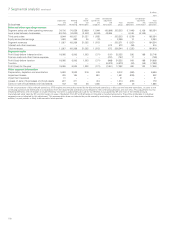
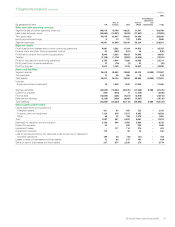
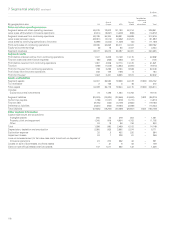
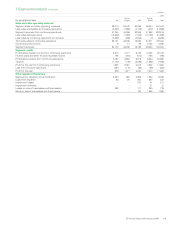
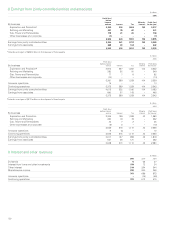
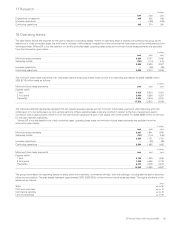
7 Segmental analysis continued
$ million
------------------------------------------------------------------------------------------------------------------------------------------------------------------------------------------------------------------------------------------------------------------------------------------------------------
2006
------------------------------------------------------------------------------------------------------------------------------------------------------------------------------------------------------------------------------------------------------------------------------------------------------------
By geographical area UK
Rest of
Europe USA
Rest of
World
Consolidation
adjustment
and
eliminations Total
------------------------------------------------------------------------------------------------------------------------------------------------------------------------------------------------------------------------------------------------------------------------------------------------------------
Sales and other operating revenues
Segment sales and other operating revenues 105,518 76,768 99,935 71,547 – 353,768
Less: sales between areas (50,942) (14,821) (5,032) (17,067) – (87,862)
------------------------------------------------------------------------------------------------------------------------------------------------------------------------------------------------------------------------------------------------------------------------------------------------------------
Third party sales 54,576 61,947 94,903 54,480 – 265,906
Equity-accounted earnings 5 13 127 3,850 – 3,995
------------------------------------------------------------------------------------------------------------------------------------------------------------------------------------------------------------------------------------------------------------------------------------------------------------
Segment revenues 54,581 61,960 95,030 58,330 – 269,901
Segment results
Profit (loss) before interest and tax from continuing operations 5,897 3,282 11,164 14,815 – 35,158
Finance costs and other finance (expense) income 43 (262) (331) 34 – (516)
------------------------------------------------------------------------------------------------------------------------------------------------------------------------------------------------------------------------------------------------------------------------------------------------------------
Profit before taxation from continuing operations 5,940 3,020 10,833 14,849 – 34,642
Taxation (3,158) (1,176) (3,553) (4,444) – (12,331)
------------------------------------------------------------------------------------------------------------------------------------------------------------------------------------------------------------------------------------------------------------------------------------------------------------
Profit for the year from continuing operations 2,782 1,844 7,280 10,405 – 22,311
Profit (loss) from Innovene operations 31 (76) (2) 22 – (25)
------------------------------------------------------------------------------------------------------------------------------------------------------------------------------------------------------------------------------------------------------------------------------------------------------------
Profit for the year 2,813 1,768 7,278 10,427 – 22,286
Assets and liabilities
Segment assets 49,018 28,059 78,586 69,479 (8,085) 217,057
Tax receivable 13 65 450 16 – 544
------------------------------------------------------------------------------------------------------------------------------------------------------------------------------------------------------------------------------------------------------------------------------------------------------------
Total assets 49,031 28,124 79,036 69,495 (8,085) 217,601
------------------------------------------------------------------------------------------------------------------------------------------------------------------------------------------------------------------------------------------------------------------------------------------------------------
Includes
Equity-accounted investments 78 1,538 1,529 17,904 – 21,049
Segment liabilities (26,048) (18,484) (32,979) (17,949) 8,085 (87,375)
Current tax payable (757) (570) 11 (1,319) – (2,635)
Finance debt (12,666) (328) (7,201) (3,815) – (24,010)
Deferred tax liabilities (3,335) (938) (9,946) (3,897) – (18,116)
------------------------------------------------------------------------------------------------------------------------------------------------------------------------------------------------------------------------------------------------------------------------------------------------------------
Total liabilities (42,806) (20,320) (50,115) (26,980) 8,085 (132,136)
Other segment information
Capital expenditure and acquisitions
Intangible assets 421 53 905 723 – 2,102
Property, plant and equipment 1,120 916 5,531 5,962 – 13,529
Other 46 22 156 1,376 – 1,600
------------------------------------------------------------------------------------------------------------------------------------------------------------------------------------------------------------------------------------------------------------------------------------------------------------
Total 1,587 991 6,592 8,061 – 17,231
------------------------------------------------------------------------------------------------------------------------------------------------------------------------------------------------------------------------------------------------------------------------------------------------------------
Depreciation, depletion and amortization 2,139 840 3,459 2,690 – 9,128
Exploration expense 20 – 633 392 – 1,045
Impairment losses – 171 114 176 – 461
Impairment reversals 176 – 90 74 – 340
Loss on remeasurement to fair value less costs to sell and on disposal of
Innovene operations 185 36 (16) (21) – 184
Losses on sale of businesses and fixed assets 12 96 217 103 – 428
Gains on sale of businesses and fixed assets 337 577 2,530 270 – 3,714