BP 2006 Annual Report Download - page 12
Download and view the complete annual report
Please find page 12 of the 2006 BP annual report below. You can navigate through the pages in the report by either clicking on the pages listed below, or by using the keyword search tool below to find specific information within the annual report.-
 1
1 -
 2
2 -
 3
3 -
 4
4 -
 5
5 -
 6
6 -
 7
7 -
 8
8 -
 9
9 -
 10
10 -
 11
11 -
 12
12 -
 13
13 -
 14
14 -
 15
15 -
 16
16 -
 17
17 -
 18
18 -
 19
19 -
 20
20 -
 21
21 -
 22
22 -
23
-
24
-
25
-
26
-
27
-
28
-
29
-
30
-
31
-
32
-
33
-
34
-
35
-
36
-
37
-
38
-
39
-
40
-
41
-
42
-
43
-
44
-
45
-
46
-
47
-
48
-
49
-
50
-
51
-
52
-
53
-
54
-
55
-
56
-
57
-
58
-
59
-
60
-
61
-
62
-
63
-
64
-
65
-
66
-
67
-
68
-
69
-
70
-
71
-
72
-
73
-
74
-
75
-
76
-
77
-
78
-
79
-
80
-
81
-
82
-
83
-
84
-
85
-
86
-
87
-
88
-
89
-
90
-
91
-
92
-
93
-
94
-
95
-
96
-
97
-
98
-
99
-
100
-
101
-
102
-
103
-
104
-
105
-
106
-
107
-
108
-
109
-
110
-
111
-
112
-
113
-
114
-
115
-
116
-
117
-
118
-
119
-
120
-
121
-
122
-
123
-
124
-
125
-
126
-
127
-
128
-
129
-
130
-
131
-
132
-
133
-
134
-
135
-
136
-
137
-
138
-
139
-
140
-
141
-
142
-
143
-
144
-
145
-
146
-
147
-
148
-
149
-
150
-
151
-
152
-
153
-
154
-
155
-
156
-
157
-
158
-
159
-
160
-
161
-
162
-
163
-
164
-
165
-
166
-
167
-
168
-
169
-
170
-
171
-
172
-
173
-
174
-
175
-
176
-
177
-
178
-
179
-
180
-
181
-
182
-
183
-
184
-
185
-
186
-
187
-
188
-
189
-
190
-
191
-
192
-
193
-
194
-
195
-
196
-
197
-
198
-
199
-
200
-
201
-
202
-
203
-
204
-
205
-
206
-
207
-
208
-
209
-
210
-
211
-
212
-
213
-
214
-
215
-
216
-
217
-
218
-
219
-
220
-
221
-
222
-
223
-
224
-
225
-
226
-
227
-
228
 |
 |

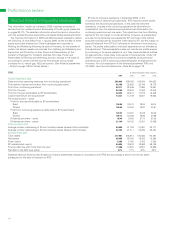
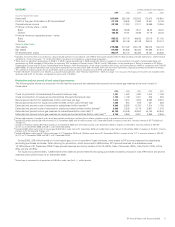
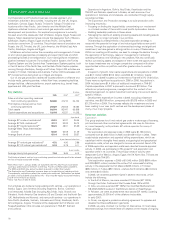
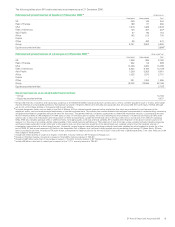
Performance review
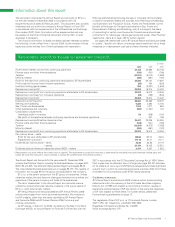
Selected financial and operating information
This information, insofar as it relates to 2006, has been extracted or
derived from the audited financial statements of the BP group presented
on pages 93-175. The selected information should be read in conjunction
with the audited financial statements and related Notes elsewhere herein.
The financial information for 2005 and 2004 has been restated to reflect
the following, all with effect from 1 January 2006: (a) the transfer of three
equity-accounted entities from Other businesses and corporate to
Refining and Marketing following the sale of Innovene; (b) the transfer of
certain mid-stream assets and activities from Refining and Marketing and
Exploration and Production to Gas, Power and Renewables; (c) the
transfer of Hydrogen for Transport activities from Gas, Power and
Renewables to Refining and Marketing; and (d) a change to the basis of
accounting for certain over-the-counter forward sale and purchase
contracts for oil, natural gas, NGLs and power. (See Financial statements
– Note 2 on page 109 for further details.)
BP sold its Innovene operations in December 2005. In the
circumstances of discontinued operations, IFRS require that the profits
earned by the discontinued operations, in this case the Innovene
operations, on sales to the continuing operations be eliminated on
consolidation from the discontinued operations and attributed to the
continuing operations and vice versa. This adjustment has two offsetting
elements: the net margin on crude refined by Innovene, as substantially
all crude for its refineries was supplied by BP and most of the refined
products manufactured by Innovene were taken by BP; and the margin on
sales of feedstock from BP’s US refineries to Innovene’s manufacturing
plants. The profits attributable to individual segments are not affected by
this adjustment. This representation does not indicate the profits earned
by continuing or Innovene operations, as if they were standalone entities,
for past periods or those likely to be earned in future periods. Under US
GAAP, Innovene operations would not be classified as discontinued
operations due to BP’s continuing customer/supplier arrangements with
Innovene. For a full description of the differences between IFRS and
US GAAP, see Financial statements – Note 53 on page 179.
IFRS $ million except per share amounts
------------------------------------------------------------------------------------------------------------------------------------------------------------------------------------------------------------------------------------------------------------------------------------------------------------
2006 2005 2004 2003
------------------------------------------------------------------------------------------------------------------------------------------------------------------------------------------------------------------------------------------------------------------------------------------------------------
Income statement data
Sales and other operating revenues from continuing operationsa265,906 239,792 192,024 164,653
Profit before interest and taxation from continuing operationsa35,158 32,682 25,746 18,776
Profit from continuing operationsa22,311 22,448 17,884 12,681
Profit for the year 22,286 22,632 17,262 12,618
Profit for the year attributable to BP shareholders 22,000 22,341 17,075 12,448
Capital expenditure and acquisitionsb17,231 14,149 16,651 19,623
Per ordinary share – cents
Profit for the year attributable to BP shareholders
Basic 109.84 105.74 78.24 56.14
Diluted 109.00 104.52 76.87 55.61
Profit from continuing operations attributable to BP shareholders
Basic 109.97 104.87 81.09 56.42
Diluted 109.12 103.66 79.66 55.89
Dividends per share – cents 38.40 34.85 27.70 25.50
Dividends per share – pence 21.104 19.152 15.251 15.658
Ordinary share datac
Average number outstanding of 25 cent ordinary shares (shares million undiluted) 20,028 21,126 21,821 22,171
Average number outstanding of 25 cent ordinary shares (shares million diluted) 20,195 21,411 22,293 22,424
Balance sheet data
Total assets 217,601 206,914 194,630 172,491
Net assets 85,465 80,765 78,235 70,264
Share capital 5,385 5,185 5,403 5,552
BP shareholders’ equity 84,624 79,976 76,892 69,139
Finance debt due after more than one year 11,086 10,230 12,907 12,869
Net debt to net debt plus equity 20% 17% 22% 22%
Selected historical financial data is based on financial statements prepared in accordance with IFRS and accordingly is shown for the four years
subsequent to the date of transition to IFRS.
10