BP 2006 Annual Report Download - page 125
Download and view the complete annual report
Please find page 125 of the 2006 BP annual report below. You can navigate through the pages in the report by either clicking on the pages listed below, or by using the keyword search tool below to find specific information within the annual report.-
 1
1 -
2
-
3
-
4
-
5
-
6
-
7
-
8
-
9
-
10
-
11
-
12
-
13
-
14
-
15
-
16
-
17
-
18
-
19
-
20
-
21
-
22
-
23
-
24
-
25
-
26
-
27
-
28
-
29
-
30
-
31
-
32
-
33
-
34
-
35
-
36
-
37
-
38
-
39
-
40
-
41
-
42
-
43
-
44
-
45
-
46
-
47
-
48
-
49
-
50
-
51
-
52
-
53
-
54
-
55
-
56
-
57
-
58
-
59
-
60
-
61
-
62
-
63
-
64
-
65
-
66
-
67
-
68
-
69
-
70
-
71
-
72
-
73
-
74
-
75
-
76
-
77
-
78
-
79
-
80
-
81
-
82
-
83
-
84
-
85
-
86
-
87
-
88
-
89
-
90
-
91
-
92
-
93
-
94
-
95
-
96
-
97
-
98
-
99
-
100
-
101
-
102
-
103
-
104
-
105
-
106
-
107
-
108
-
109
-
110
-
111
-
112
-
113
-
114
-
 115
115 -
 116
116 -
 117
117 -
 118
118 -
 119
119 -
 120
120 -
 121
121 -
 122
122 -
 123
123 -
 124
124 -
 125
125 -
 126
126 -
 127
127 -
 128
128 -
 129
129 -
 130
130 -
 131
131 -
 132
132 -
 133
133 -
 134
134 -
 135
135 -
136
-
137
-
138
-
139
-
140
-
141
-
142
-
143
-
144
-
145
-
146
-
147
-
148
-
149
-
150
-
151
-
152
-
153
-
154
-
155
-
156
-
157
-
158
-
159
-
160
-
161
-
162
-
163
-
164
-
165
-
166
-
167
-
168
-
169
-
170
-
171
-
172
-
173
-
174
-
175
-
176
-
177
-
178
-
179
-
180
-
181
-
182
-
183
-
184
-
185
-
186
-
187
-
188
-
189
-
190
-
191
-
192
-
193
-
194
-
195
-
196
-
197
-
198
-
199
-
200
-
201
-
202
-
203
-
204
-
205
-
206
-
207
-
208
-
209
-
210
-
211
-
212
-
213
-
214
-
215
-
216
-
217
-
218
-
219
-
220
-
221
-
222
-
223
-
224
-
225
-
226
-
227
-
228
 |
 |

BP Annual Report and Accounts 2006 123
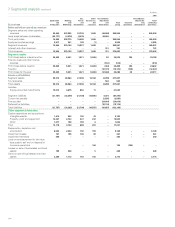
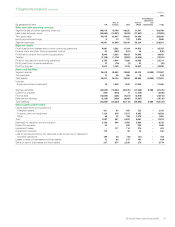
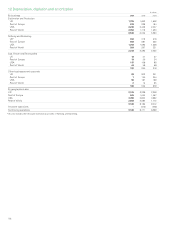
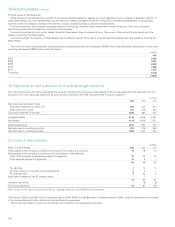
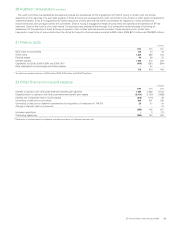
13 Impairment and losses on sale of businesses and fixed assets
$ million
------------------------------------------------------------------------------------------------------------------------------------------------------------------------------------------------------------------------------------------------------------------------------------------------------------
2006 2005 2004
------------------------------------------------------------------------------------------------------------------------------------------------------------------------------------------------------------------------------------------------------------------------------------------------------------
Impairment losses
Exploration and Production 137 266 435
Refining and Marketing 155 93 195
Gas, Power and Renewables 100 ––
Other businesses and corporate 69 59 891
------------------------------------------------------------------------------------------------------------------------------------------------------------------------------------------------------------------------------------------------------------------------------------------------------------
461 418 1,521
------------------------------------------------------------------------------------------------------------------------------------------------------------------------------------------------------------------------------------------------------------------------------------------------------------
Impairment reversals
Exploration and Production (340) –(31)
------------------------------------------------------------------------------------------------------------------------------------------------------------------------------------------------------------------------------------------------------------------------------------------------------------
(340) –(31)
------------------------------------------------------------------------------------------------------------------------------------------------------------------------------------------------------------------------------------------------------------------------------------------------------------
Loss on sale of businesses or termination of operations
Refining and Marketing ––279
Other businesses and corporate ––416
------------------------------------------------------------------------------------------------------------------------------------------------------------------------------------------------------------------------------------------------------------------------------------------------------------
––695
------------------------------------------------------------------------------------------------------------------------------------------------------------------------------------------------------------------------------------------------------------------------------------------------------------
Loss on sale of fixed assets
Exploration and Production 195 39 227
Refining and Marketing 228 64 92
Other businesses and corporate 56–
------------------------------------------------------------------------------------------------------------------------------------------------------------------------------------------------------------------------------------------------------------------------------------------------------------
428 109 319
Loss on remeasurement to fair value less costs to sell and on disposal of Innovene operations 184 591 –
------------------------------------------------------------------------------------------------------------------------------------------------------------------------------------------------------------------------------------------------------------------------------------------------------------
733 1,118 2,504
Innovene operations (184) (650) (1,114)
------------------------------------------------------------------------------------------------------------------------------------------------------------------------------------------------------------------------------------------------------------------------------------------------------------
Continuing operations 549 468 1,390
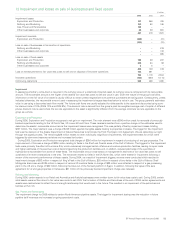
Impairment
In assessing whether a write-down is required in the carrying value of a potentially impaired asset, its carrying value is compared with its recoverable
amount. The recoverable amount is the higher of the asset’s fair value less costs to sell and value in use. Given the nature of the group’s activities,
information on the fair value of an asset is usually difficult to obtain unless negotiations with potential purchasers are taking place. Consequently,unless
indicated otherwise, the recoverable amount used in assessing the impairment charges described below is value in use. The group generally estimates
value in use using a discounted cash flow model. The future cash flows are usually adjusted for risks specific to the asset and discounted using a pre-
tax discount rate of 10% (2005 10% and 2004 9%). This discount rate is derived from the group’s post-tax weighted average cost of capital. A different
pre-tax discount rate is used where the tax rate applicable to the asset is significantly different from the average corporate tax rate applicable to the
group as a whole.
Exploration and Production
During 2006, Exploration and Production recognized a net gain on impairment. The main element was a $340 million credit for reversals of previously
booked impairments relating to the UK North Sea, US Lower 48 and China. These reversals resulted from a positive change in the estimates used to
determine the assets’ recoverable amount since the impairment losses were recognised. This was partially offset by impairment losses totalling
$137 million. The major element was a charge of $109 million against intangible assets relating to properties in Alaska. The trigger for the impairment
test was the decision of the Alaska Department of Natural Resources to terminate the Point Thompson Unit Agreement. We are defending our right
through the appeal process. The remaining $28 million relates to other individually insignificant impairments, the impairment tests for which were
triggered by downward reserves revisions and increased tax burden.
During 2005, Exploration and Production recognized total charges of $266 million for impairment in respect of producing oil and gas properties. The
major element of this was a charge of $226 million relating to fields in the Shelf and Coastal areas of the Gulf of Mexico. The triggers for the impairment
tests were primarily the effect of Hurricane Rita, which extensively damaged certain offshore and onshore production facilities, leading to repair costs
and higher estimates of the eventual cost of decommissioning the production facilities and, in addition, reduced estimates of the quantities of
hydrocarbons recoverable from some of these fields. The recoverable amount was based on management’s estimate of fair value less costs to sell
consistent with recent transactions in the area. The remainder related to fields in the UK North Sea, which were tested for impairment following a
review of the economic performance of these assets. During 2004, as a result of impairment triggers, reviews were conducted which resulted in
impairment charges of $83 million in respect of King’s Peak in the Gulf of Mexico, $20 million in respect of two fields in the Gulf of Mexico Shelf
Matagorda Island area and $184 million in respect of various US onshore fields. A charge of $88 million was reflected in respect of a gas processing
plant in the US and a charge of $60 million following the blow-out of the Temsah platform in Egypt. In addition, following the lapse of the sale
agreement for oil and gas properties in Venezuela, $31 million of the previously booked impairment charge was released.
Refining and Marketing
During 2006, certain assets in our Retail and Aromatics and Acetyls businesses were written down to fair value less costs to sell. During 2005, certain
retail assets were written down to fair value less costs to sell. With the formation of Olefins and Derivatives at the end of 2004 certain agreements and
assets were restructured to reflect the arm’s-length relationship that would exist in the future. This resulted in an impairment of the petrochemical
facilities at Hull, UK.
Gas, Power and Renewables
The impairment charge for 2006 relates to certain North American pipeline assets. The trigger for impairment testing was the reduction in future
pipeline tariff revenues and increased on-going operational costs.