BP 2006 Annual Report Download - page 111
Download and view the complete annual report
Please find page 111 of the 2006 BP annual report below. You can navigate through the pages in the report by either clicking on the pages listed below, or by using the keyword search tool below to find specific information within the annual report.-
 1
1 -
2
-
3
-
4
-
5
-
6
-
7
-
8
-
9
-
10
-
11
-
12
-
13
-
14
-
15
-
16
-
17
-
18
-
19
-
20
-
21
-
22
-
23
-
24
-
25
-
26
-
27
-
28
-
29
-
30
-
31
-
32
-
33
-
34
-
35
-
36
-
37
-
38
-
39
-
40
-
41
-
42
-
43
-
44
-
45
-
46
-
47
-
48
-
49
-
50
-
51
-
52
-
53
-
54
-
55
-
56
-
57
-
58
-
59
-
60
-
61
-
62
-
63
-
64
-
65
-
66
-
67
-
68
-
69
-
70
-
71
-
72
-
73
-
74
-
75
-
76
-
77
-
78
-
79
-
80
-
81
-
82
-
83
-
84
-
85
-
86
-
87
-
88
-
89
-
90
-
91
-
92
-
93
-
94
-
95
-
96
-
97
-
98
-
99
-
100
-
 101
101 -
 102
102 -
 103
103 -
 104
104 -
 105
105 -
 106
106 -
 107
107 -
 108
108 -
 109
109 -
 110
110 -
 111
111 -
 112
112 -
 113
113 -
 114
114 -
 115
115 -
 116
116 -
 117
117 -
 118
118 -
 119
119 -
 120
120 -
 121
121 -
122
-
123
-
124
-
125
-
126
-
127
-
128
-
129
-
130
-
131
-
132
-
133
-
134
-
135
-
136
-
137
-
138
-
139
-
140
-
141
-
142
-
143
-
144
-
145
-
146
-
147
-
148
-
149
-
150
-
151
-
152
-
153
-
154
-
155
-
156
-
157
-
158
-
159
-
160
-
161
-
162
-
163
-
164
-
165
-
166
-
167
-
168
-
169
-
170
-
171
-
172
-
173
-
174
-
175
-
176
-
177
-
178
-
179
-
180
-
181
-
182
-
183
-
184
-
185
-
186
-
187
-
188
-
189
-
190
-
191
-
192
-
193
-
194
-
195
-
196
-
197
-
198
-
199
-
200
-
201
-
202
-
203
-
204
-
205
-
206
-
207
-
208
-
209
-
210
-
211
-
212
-
213
-
214
-
215
-
216
-
217
-
218
-
219
-
220
-
221
-
222
-
223
-
224
-
225
-
226
-
227
-
228
 |
 |

BP Annual Report and Accounts 2006 109
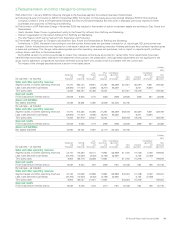
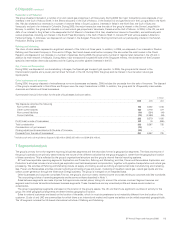
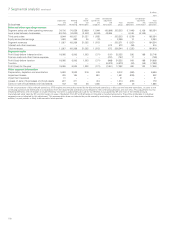
2 Resegmentation and other changes to comparatives
With effect from 1 January 2006 the following changes to the business segment boundaries have been implemented:
(a) Following the sale of Innovene to INEOS in December 2005, the transfer of three equity-accounted entities (Shanghai SECCO Petrochemical
Company Limited in China and Polyethylene Malaysia Sdn Bhd and Ethylene Malaysia Sdn Bhd, both in Malaysia), previously reported in Other
businesses and corporate, to Refining and Marketing.
(b) The formation of BP Alternative Energy in November 2005 has resulted in the transfer of certain mid-stream assets and activities to Gas, Power and
Renewables:
– South Houston Green Power co-generation facility (in the Texas City refinery) from Refining and Marketing.
– Watson Cogeneration (in the Carson refinery) from Refining and Marketing.
– Phu My Phase 3 CCGT plant in Vietnam from Exploration and Production.
(c) The transfer of Hydrogen for Transport activities from Gas, Power and Renewables to Refining and Marketing.
Furthermore, in 2005, the basis of accounting for over-the-counter forward sale and purchase contracts for oil, natural gas, NGLs and power was
changed. Certain transactions are now reported on a net basis in sales and other operating revenues, whereas previously they had been reported gross
in sales and purchases. This change, while reducing sales and other operating revenues and purchases, had no impact on reported profit, profit per
ordinary share, cash flow or the balance sheet.
During 2006, as part of a continuous process to review how individual contracts are accounted for, certain other minor adjustments have been
identified that should have been reflected in the restatement from gross to net presentation. Although these adjustments are not significant to the
group income statement, comparatives have been amended to bring them onto a basis which is consistent with the current year.
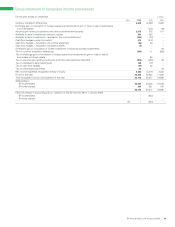
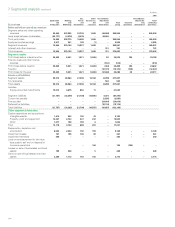
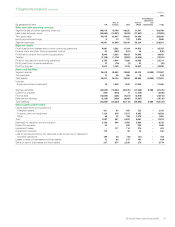
The impact of the changes described above is shown in the tables below.
$ million
------------------------------------------------------------------------------------------------------------------------------------------------------------------------------------------------------------------------------------------------------------------------------------------------------------
2005
------------------------------------------------------------------------------------------------------------------------------------------------------------------------------------------------------------------------------------------------------------------------------------------------------------
By business – as reported
Exploration
and
Production
Refining
and
Marketing
Gas,
Power
and
Renewables
Other
businesses
and
corporate
Consolidation
adjustment
and
eliminations
Total
group
Innovene
operations
Consolidation
adjustment
and
eliminations
Total
continuing
operations
------------------------------------------------------------------------------------------------------------------------------------------------------------------------------------------------------------------------------------------------------------------------------------------------------------
Sales and other operating revenues
Segment sales and other operating revenues 47,210 220,134 28,561 21,295 (55,359) 261,841 (20,627) 8,251 249,465
Less: sales between businesses (32,606) (11,407) (3,095) (8,251) 55,359 – 8,251 (8,251) –
------------------------------------------------------------------------------------------------------------------------------------------------------------------------------------------------------------------------------------------------------------------------------------------------------------
Third party sales 14,604 208,727 25,466 13,044 – 261,841 (12,376) – 249,465
Segment results
Profit (loss) before interest and tax 25,508 6,942 1,104 (523) (208) 32,823 (668) 527 32,682
Assets and liabilities
Net assets (liabilities) 73,092 45,625 5,095 (2,602) (40,445) 80,765
By business – as restated
------------------------------------------------------------------------------------------------------------------------------------------------------------------------------------------------------------------------------------------------------------------------------------------------------------
Sales and other operating revenues
Segment sales and other operating revenues 47,210 213,326 25,696 21,295 (55,359) 252,168 (20,627) 8,251 239,792
Less: sales between businesses (32,606) (11,407) (3,095) (8,251) 55,359 – 8,251 (8,251) –
------------------------------------------------------------------------------------------------------------------------------------------------------------------------------------------------------------------------------------------------------------------------------------------------------------
Third party sales 14,604 201,919 22,601 13,044 – 252,168 (12,376) – 239,792
Segment results
Profit (loss) before interest and tax 25,502 6,926 1,172 (569) (208) 32,823 (668) 527 32,682
Assets and liabilities
Net assets (liabilities) 73,060 45,734 5,587 (3,171) (40,445) 80,765
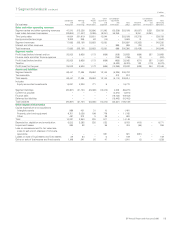
$ million
------------------------------------------------------------------------------------------------------------------------------------------------------------------------------------------------------------------------------------------------------------------------------------------------------------
2004
------------------------------------------------------------------------------------------------------------------------------------------------------------------------------------------------------------------------------------------------------------------------------------------------------------
By business – as reported
Exploration
and
Production
Refining
and
Marketing
Gas,
Power
and
Renewables
Other
businesses
and
corporate
Consolidation
adjustment
and
eliminations
Total
group
Innovene
operations
Consolidation
adjustment
and
eliminations
Total
continuing
operations
------------------------------------------------------------------------------------------------------------------------------------------------------------------------------------------------------------------------------------------------------------------------------------------------------------
Sales and other operating revenues
Segment sales and other operating revenues 34,700 176,350 26,110 17,994 (43,999) 211,155 (17,448) 6,169 199,876
Less: sales between businesses (24,756) (10,632) (2,442) (6,169) 43,999 – 6,169 (6,169) –
------------------------------------------------------------------------------------------------------------------------------------------------------------------------------------------------------------------------------------------------------------------------------------------------------------
Third party sales 9,944 165,718 23,668 11,825 – 211,155 (11,279) – 199,876
Segment results
Profit (loss) before interest and tax 18,087 6,544 954 (362) (191) 25,032 526 188 25,746
By business – as restated
------------------------------------------------------------------------------------------------------------------------------------------------------------------------------------------------------------------------------------------------------------------------------------------------------------
Sales and other operating revenues
Segment sales and other operating revenues 34,700 170,639 23,969 17,994 (43,999) 203,303 (17,448) 6,169 192,024
Less: sales between businesses (24,756) (10,632) (2,442) (6,169) 43,999 – 6,169 (6,169) –
------------------------------------------------------------------------------------------------------------------------------------------------------------------------------------------------------------------------------------------------------------------------------------------------------------
Third party sales 9,944 160,007 21,527 11,825 – 203,303 (11,279) – 192,024
Segment results
Profit (loss) before interest and tax 18,085 6,506 1,003 (371) (191) 25,032 526 188 25,746