BP 2006 Annual Report Download - page 138
Download and view the complete annual report
Please find page 138 of the 2006 BP annual report below. You can navigate through the pages in the report by either clicking on the pages listed below, or by using the keyword search tool below to find specific information within the annual report.-
 1
1 -
2
-
3
-
4
-
5
-
6
-
7
-
8
-
9
-
10
-
11
-
12
-
13
-
14
-
15
-
16
-
17
-
18
-
19
-
20
-
21
-
22
-
23
-
24
-
25
-
26
-
27
-
28
-
29
-
30
-
31
-
32
-
33
-
34
-
35
-
36
-
37
-
38
-
39
-
40
-
41
-
42
-
43
-
44
-
45
-
46
-
47
-
48
-
49
-
50
-
51
-
52
-
53
-
54
-
55
-
56
-
57
-
58
-
59
-
60
-
61
-
62
-
63
-
64
-
65
-
66
-
67
-
68
-
69
-
70
-
71
-
72
-
73
-
74
-
75
-
76
-
77
-
78
-
79
-
80
-
81
-
82
-
83
-
84
-
85
-
86
-
87
-
88
-
89
-
90
-
91
-
92
-
93
-
94
-
95
-
96
-
97
-
98
-
99
-
100
-
101
-
102
-
103
-
104
-
105
-
106
-
107
-
108
-
109
-
110
-
111
-
112
-
113
-
114
-
115
-
116
-
117
-
118
-
119
-
120
-
121
-
122
-
123
-
124
-
125
-
126
-
127
-
 128
128 -
 129
129 -
 130
130 -
 131
131 -
 132
132 -
 133
133 -
 134
134 -
 135
135 -
 136
136 -
 137
137 -
 138
138 -
 139
139 -
 140
140 -
 141
141 -
 142
142 -
 143
143 -
 144
144 -
 145
145 -
 146
146 -
 147
147 -
 148
148 -
149
-
150
-
151
-
152
-
153
-
154
-
155
-
156
-
157
-
158
-
159
-
160
-
161
-
162
-
163
-
164
-
165
-
166
-
167
-
168
-
169
-
170
-
171
-
172
-
173
-
174
-
175
-
176
-
177
-
178
-
179
-
180
-
181
-
182
-
183
-
184
-
185
-
186
-
187
-
188
-
189
-
190
-
191
-
192
-
193
-
194
-
195
-
196
-
197
-
198
-
199
-
200
-
201
-
202
-
203
-
204
-
205
-
206
-
207
-
208
-
209
-
210
-
211
-
212
-
213
-
214
-
215
-
216
-
217
-
218
-
219
-
220
-
221
-
222
-
223
-
224
-
225
-
226
-
227
-
228
 |
 |

136
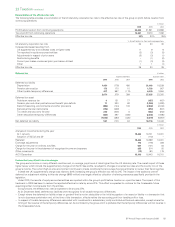
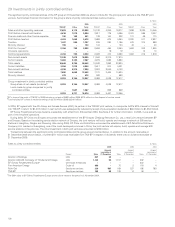
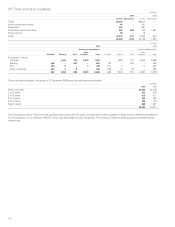
29 Investments in jointly controlled entities
The significant jointly controlled entities of the BP group at 31 December 2006 are shown in Note 50. The principal joint venture is the TNK-BP joint
venture. Summarized financial information for the group’s share of jointly controlled entities is shown below.
$ million
------------------------------------------------------------------------------------------------------------------------------------------------------------------------------------------------------------------------------------------------------------------------------------------------------------
2006 2005 2004
------------------------------------------------------------------------------------------------------------------------------------------------------------------------------------------------------------------------------------------------------------------------------------------------------------
TNK-BP Other Total TNK-BP Other Total TNK-BP Other Total
------------------------------------------------------------------------------------------------------------------------------------------------------------------------------------------------------------------------------------------------------------------------------------------------------------
Sales and other operating revenues 17,863 6,119 23,982 15,122 4,255 19,377 7,839 2,225 10,064
------------------------------------------------------------------------------------------------------------------------------------------------------------------------------------------------------------------------------------------------------------------------------------------------------------
Profit before interest and taxation 4,616 1,218 5,834 3,817 779 4,596 2,421 586 3,007
Finance costs and other finance expense 192 169 361 128 104 232 101 69 170
------------------------------------------------------------------------------------------------------------------------------------------------------------------------------------------------------------------------------------------------------------------------------------------------------------
Profit before taxation 4,424 1,049 5,473 3,689 675 4,364 2,320 517 2,837
Taxation 1,467 260 1,727 976 220 1,196 675 314 989
Minority interest 193 – 193 104 – 104 43 – 43
------------------------------------------------------------------------------------------------------------------------------------------------------------------------------------------------------------------------------------------------------------------------------------------------------------
Profit for the yeara2,764 789 3,553 2,609 455 3,064 1,602 203 1,805
Innovene operations –––– 19 19 – 13 13
------------------------------------------------------------------------------------------------------------------------------------------------------------------------------------------------------------------------------------------------------------------------------------------------------------
Continuing operations 2,764 789 3,553 2,609 474 3,083 1,602 216 1,818
Non-current assets 11,243 7,612 18,855 11,564 6,310 17,874
Current assets 5,403 2,184 7,587 4,278 1,682 5,960
----------------------------------------------------------------------------------------------------------------------------------------------------------------------------------------------------------------------------------------
Total assets 16,646 9,796 26,442 15,842 7,992 23,834
----------------------------------------------------------------------------------------------------------------------------------------------------------------------------------------------------------------------------------------
Current liabilities 3,594 1,272 4,866 3,617 914 4,531
Non-current liabilities 4,226 3,370 7,596 3,553 2,550 6,103
----------------------------------------------------------------------------------------------------------------------------------------------------------------------------------------------------------------------------------------
Total liabilities 7,820 4,642 12,462 7,170 3,464 10,634
Minority interest 473 – 473 583 – 583
----------------------------------------------------------------------------------------------------------------------------------------------------------------------------------------------------------------------------------------
8,353 5,154 13,507 8,089 4,528 12,617
Group investment in jointly controlled entities
Group share of net assets (as above)b8,353 5,154 13,507 8,089 4,528 12,617
Loans made by group companies to jointly
controlled entities – 1,567 1,567 – 939 939
----------------------------------------------------------------------------------------------------------------------------------------------------------------------------------------------------------------------------------------
8,353 6,721 15,074 8,089 5,467 13,556
aBP’s share of the profit of TNK-BP in 2006 includes a net gain of $892 million (2005 $270 million) on the disposal of certain assets.
bTotal includes BP’s share of retained earnings of $2,752 million (2005 $2,242 million).
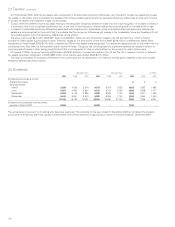
In 2004, BP agreed with the Alfa Group and Access-Renova (AAR), its partner in the TNK-BP joint venture, to incorporate AAR’s 50% interest in Slavneft
into TNK-BP in return for $1,418 million in cash (which was subsequently reduced by receipt of pre-acquisition dividends of $64 million to $1,354 million).
BP Solvay Polyethylene Europe became a subsidiary with effect from 2 November 2004. See Note 4 for further information. In 2005, it was sold as
part of the Innovene operations.
During 2004, BP China and Sinopec announced the establishment of the BP-Sinopec (Zhejiang) Petroleum Co. Ltd, a retail joint venture between BP
and Sinopec. Based on the existing service station network of Sinopec, the joint venture will build, operate and manage a network of 500 service
stations in Hangzhou, Ningbo and Shaoxing. Also during 2004, BP China and PetroChina announced the establishment of BP-PetroChina Petroleum
Company Ltd. Located in Guangdong, one of the most developed provinces in China, the joint venture will acquire, build, operate and manage 500
service stations in the province. The initial investment in both joint ventures amounted to $106 million.
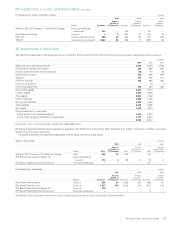
Transactions between the significant jointly controlled entities and the group are summarized below. In addition to the amount receivable at
31 December 2005 shown below, a further $771 million was receivable from TNK-BP in respect of dividends: there was no dividend receivable at
31 December 2006.
Sales to jointly controlled entities $ million
------------------------------------------------------------------------------------------------------------------------------------------------------------------------------------------------------------------------------------------------------------------------------------------------------------
2006 2005 2004
------------------------------------------------------------------------------------------------------------------------------------------------------------------------------------------------------------------------------------------------------------------------------------------------------------
Product Sales
Amount
receivable at
31 December Sales
Amount
receivable at
31 December Sales
Amount
receivable at
31 December
------------------------------------------------------------------------------------------------------------------------------------------------------------------------------------------------------------------------------------------------------------------------------------------------------------
Atlantic 4 Holdings LNG 227 35 ––––
Atlantic LNG 2/3 Company of Trinidad and Tobago LNG 1,123 99 1,157 – 532 –
BP Solvay Polyethylene EuropeaChemicals feedstocks ––––230–
Pan American Energy Crude oil 389 – 75 2 118 4
Ruhr Oel Employee services 330 597 169 527 192 780
TNK-BP Employee services 189 99 125 14 49 –
aThe 2004 sales to BP Solvay Polyethylene Europe shown above relate to the period to 2 November 2004.