BP 2006 Annual Report Download - page 189
Download and view the complete annual report
Please find page 189 of the 2006 BP annual report below. You can navigate through the pages in the report by either clicking on the pages listed below, or by using the keyword search tool below to find specific information within the annual report.
BP Annual Report and Accounts 2006 187
53 US GAAP reconciliation continued
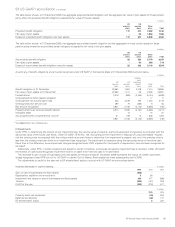
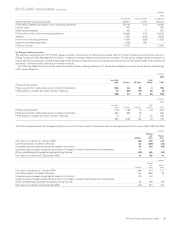
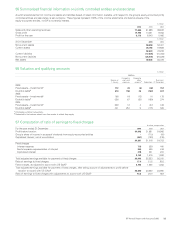
The table below shows, at 31 December 2006, the aggregate projected benefit obligation and the aggregate fair value of plan assets for those pension
plans where the projected benefit obligation exceeds the fair value of the plan assets.
$ million
------------------------------------------------------------------------------------------------------------------------------------------------------------------------------------------------------------------------------------------------------------------------------------------------------------
UK
pension
plans
US
pension
plans
Other
plans Total
------------------------------------------------------------------------------------------------------------------------------------------------------------------------------------------------------------------------------------------------------------------------------------------------------------
Projected benefit obligation 117 411 7,082 7,610
Fair value of plan assets – 54 1,554 1,608
------------------------------------------------------------------------------------------------------------------------------------------------------------------------------------------------------------------------------------------------------------------------------------------------------------
Excess of projected benefit obligation over plan assets 117 357 5,528 6,002
The table below shows, at 31 December 2006, the aggregate accumulated benefit obligation and the aggregate fair value of plan assets for those
pension plans where the accumulated benefit obligation exceeds the fair value of the plan assets.
$ million
------------------------------------------------------------------------------------------------------------------------------------------------------------------------------------------------------------------------------------------------------------------------------------------------------------
UK
pension
plans
US
pension
plans
Other
plans Total
------------------------------------------------------------------------------------------------------------------------------------------------------------------------------------------------------------------------------------------------------------------------------------------------------------
Accumulated benefit obligation 92 386 5,770 6,248
Fair value of plan assets – 54 660 714
------------------------------------------------------------------------------------------------------------------------------------------------------------------------------------------------------------------------------------------------------------------------------------------------------------
Excess of accumulated benefit obligation over plan assets 92 332 5,110 5,534
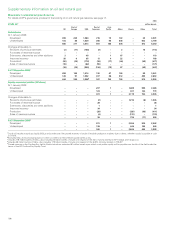
A summary of benefit obligations and amounts recognized under US GAAP in the balance sheet at 31 December 2005 is shown below.
$ million
------------------------------------------------------------------------------------------------------------------------------------------------------------------------------------------------------------------------------------------------------------------------------------------------------------
UK
pension
plans
US
pension
plans
US other
post-
retirement
benefit
plans
Other
plans Total
------------------------------------------------------------------------------------------------------------------------------------------------------------------------------------------------------------------------------------------------------------------------------------------------------------
Benefit obligation at 31 December 20,063 7,900 3,478 7,414 38,855
Fair value of plan assets at 31 December 23,282 7,317 28 2,280 32,907
------------------------------------------------------------------------------------------------------------------------------------------------------------------------------------------------------------------------------------------------------------------------------------------------------------
Funded status 3,219 (583) (3,450) (5,134) (5,948)
Unrecognized transition (asset) obligation – – – 17 17
Unrecognized net actuarial (gain) loss 222 3,249 793 1,454 5,718
Unrecognized prior service cost 490 70 (485) 8 83
------------------------------------------------------------------------------------------------------------------------------------------------------------------------------------------------------------------------------------------------------------------------------------------------------------
Net amount recognized 3,931 2,736 (3,142) (3,655) (130)
Prepaid benefit cost (accrued benefit liability) 3,910 2,535 (3,154) (4,508) (1,217)
Intangible asset – 12 – 15 27
Accumulated other comprehensive incomea21 189 12 838 1,060
------------------------------------------------------------------------------------------------------------------------------------------------------------------------------------------------------------------------------------------------------------------------------------------------------------
3,931 2,736 (3,142) (3,655) (130)
aTotal $866 million net of deferred tax.
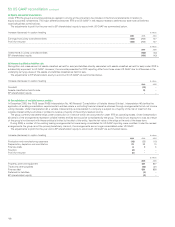
(i) Impairments
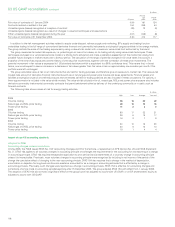
Under IFRS, in determining the amount of any impairment loss, the carrying value of property, plant and equipment and goodwill is compared with the
discounted value of the future cash flows. Under US GAAP, SFAS No. 144 ‘Accounting for the Impairment or Disposal of Long-lived Assets’ requires
that the carrying value is compared with the undiscounted future cash flows to determine if an impairment is present, and only if the carrying value is
less than the undiscounted cash flows is an impairment loss recognized. The impairment is measured using the discounted value of the future cash
flows. Due to this difference, some impairment charges recognized under IFRS, adjusted for the impacts of depreciation, have not been recognized for
US GAAP.
Additionally, under IFRS, in certain situations and subject to certain limitations, a previously-recognized impairment loss is reversed. Under US GAAP,
the reversal of a previously-recognized impairment loss for an asset to be held and used is not permitted.
The decrease to gain on sale of businesses and fixed assets for the year ended 31 December 2006 represents the impact of a 2005 impairment
charge recognized under IFRS but not for US GAAP on certain Gulf of Mexico Shelf assets that were subsequently sold in 2006.
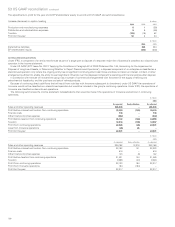
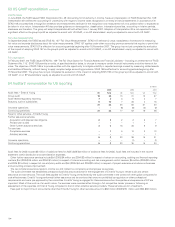
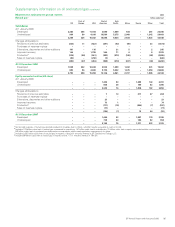
The adjustments to profit for the year and to BP shareholders’ equity to accord with US GAAP are summarized below.
Increase (decrease) in caption heading $ million
------------------------------------------------------------------------------------------------------------------------------------------------------------------------------------------------------------------------------------------------------------------------------------------------------------
2006 2005 2004
------------------------------------------------------------------------------------------------------------------------------------------------------------------------------------------------------------------------------------------------------------------------------------------------------------
Gain on sale of businesses and fixed assets (208) ––
Depreciation, depletion and amortization 628 –
Impairment and losses on sale of businesses and fixed assets 340 477 (986)
Taxation (222) (127) 309
Profit for the year (332) (378) 677
$ million
------------------------------------------------------------------------------------------------------------------------------------------------------------------------------------------------------------------------------------------------------------------------------------------------------------
2006 2005
------------------------------------------------------------------------------------------------------------------------------------------------------------------------------------------------------------------------------------------------------------------------------------------------------------
Property, plant and equipment (40) 504
Deferred tax liabilities (42) 177
BP shareholders’ equity 2327


