BP 2006 Annual Report Download - page 53
Download and view the complete annual report
Please find page 53 of the 2006 BP annual report below. You can navigate through the pages in the report by either clicking on the pages listed below, or by using the keyword search tool below to find specific information within the annual report.-
 1
1 -
2
-
3
-
4
-
5
-
6
-
7
-
8
-
9
-
10
-
11
-
12
-
13
-
14
-
15
-
16
-
17
-
18
-
19
-
20
-
21
-
22
-
23
-
24
-
25
-
26
-
27
-
28
-
29
-
30
-
31
-
32
-
33
-
34
-
35
-
36
-
37
-
38
-
39
-
40
-
41
-
42
-
 43
43 -
 44
44 -
 45
45 -
 46
46 -
 47
47 -
 48
48 -
 49
49 -
 50
50 -
 51
51 -
 52
52 -
 53
53 -
 54
54 -
 55
55 -
 56
56 -
 57
57 -
 58
58 -
 59
59 -
 60
60 -
 61
61 -
 62
62 -
 63
63 -
64
-
65
-
66
-
67
-
68
-
69
-
70
-
71
-
72
-
73
-
74
-
75
-
76
-
77
-
78
-
79
-
80
-
81
-
82
-
83
-
84
-
85
-
86
-
87
-
88
-
89
-
90
-
91
-
92
-
93
-
94
-
95
-
96
-
97
-
98
-
99
-
100
-
101
-
102
-
103
-
104
-
105
-
106
-
107
-
108
-
109
-
110
-
111
-
112
-
113
-
114
-
115
-
116
-
117
-
118
-
119
-
120
-
121
-
122
-
123
-
124
-
125
-
126
-
127
-
128
-
129
-
130
-
131
-
132
-
133
-
134
-
135
-
136
-
137
-
138
-
139
-
140
-
141
-
142
-
143
-
144
-
145
-
146
-
147
-
148
-
149
-
150
-
151
-
152
-
153
-
154
-
155
-
156
-
157
-
158
-
159
-
160
-
161
-
162
-
163
-
164
-
165
-
166
-
167
-
168
-
169
-
170
-
171
-
172
-
173
-
174
-
175
-
176
-
177
-
178
-
179
-
180
-
181
-
182
-
183
-
184
-
185
-
186
-
187
-
188
-
189
-
190
-
191
-
192
-
193
-
194
-
195
-
196
-
197
-
198
-
199
-
200
-
201
-
202
-
203
-
204
-
205
-
206
-
207
-
208
-
209
-
210
-
211
-
212
-
213
-
214
-
215
-
216
-
217
-
218
-
219
-
220
-
221
-
222
-
223
-
224
-
225
-
226
-
227
-
228
 |
 |

individually insignificant impairments), and was after inventory holding
losses of $18 million and charges for legal provisions of $335 million.
Profit before interest and tax for the year ended 31 December 2005
was $25,502 million, including inventory holding gains of $17 million and
net gains of $1,159 million on the sales of assets, primarily from our
interest in the Ormen Lange field in Norway, and was after net fair value
losses of $1,688 million on embedded derivatives, an impairment charge
of $226 million in respect of fields in the Gulf of Mexico, a charge for
impairment of $40 million relating to fields in the UK North Sea and
a charge of $265 million on the cancellation of an intra-group gas
supply contract.
Profit before interest and tax for the year ended 31 December 2004
was $18,085 million, including inventory holding gains of $10 million, and
was after an impairment charge of $267 million in respect of fields in the
deepwater Gulf of Mexico and US onshore, an impairment charge of $108
million in respect of a gas processing plant in the US and a field in the
Gulf of Mexico shelf, an impairment charge of $60 million in respect of
the partner-operated Temsah platform in Egypt following a blow-out, a net
loss on disposal of $65 million and a charge of $35 million in respect of
Alaskan tankers that were no longer required. In addition, following the
lapse of the sale agreement for oil and gas properties in Venezuela,
$31 million of the previously booked impairment was reversed.
The primary additional factors reflected in profit before interest and tax
for the year ended 31 December 2006 compared with the year ended
31 December 2005 were higher overall realizations contributing around
$5,050 million (liquids realizations were higher and gas realizations were
lower), partially offset by decreases of around $1,825 million due to
lower reported volumes, $350 million due to higher production taxes and
$1,950 million due higher costs, reflecting the impacts of sector-specific
inflation, increased integrity spend and revenue investments. Additionally,
BP’s share of the TNK-BP result was higher by around $500 million,
primarily reflecting higher disposal gains.
The primary additional factors reflected in profit before interest and tax
for the year ended 31 December 2005 compared with the year ended 31
December 2004 were higher liquids and gas realizations contributing
around $10,100 million and around $400 million from higher volumes (in
areas not affected by hurricanes), partially offset by a decrease of around
$900 million due to the hurricane impact on volumes, costs associated
with hurricane repairs and Thunder Horse of around $200 million and
higher operating and revenue investment costs of around $1,700 million.
Total production for 2006 was 2,629mboe/d for subsidiaries and
1,297mboe/d for equity-accounted entities, compared with 2,718mboe/d
and 1,296mboe/d respectively in 2005. For subsidiaries, increases in
production in our new profit centres were offset by anticipated decline in
our existing profit centres and the effect of disposals.
Actual production for subsidiaries and equity-accounted entities in
2006 of 2,629mboe/d and 1,297mboe/d respectively, compared with
2,649mboe/d and 1,301mboe/d previously indicated at the time of our
third-quarter results.
Total production for 2005 was 2,718mboe/d for subsidiaries and
1,296mboe/d for equity-accounted entities, compared with 2,795mboe/d
and 1,202mboe/d respectively in 2004. For subsidiaries, increases in
production in our new profit centres were more than offset by the effect
of the hurricanes, higher planned maintenance shutdowns and anticipated
decline in our existing profit centres. For equity-accounted entities, this
primarily reflects growth from TNK-BP.
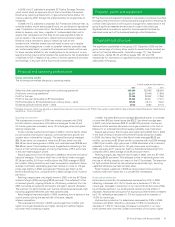
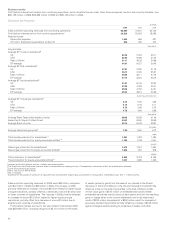
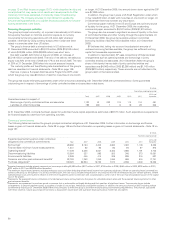
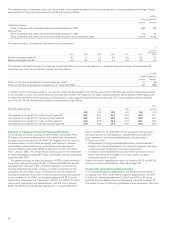
Refining and Marketing
$million
------------------------------------------------------------------------------------------------------------------------------------------------------------------------------------------------------------------------------------------------------------------------------------------------------------
2006 2005 2004
------------------------------------------------------------------------------------------------------------------------------------------------------------------------------------------------------------------------------------------------------------------------------------------------------------
Sales and other operating revenues from continuing operations 232,855 213,326 170,639
Profit before interest and tax from continuing operationsa5,041 6,926 6,506
$/bbl
------------------------------------------------------------------------------------------------------------------------------------------------------------------------------------------------------------------------------------------------------------------------------------------------------------
Global Indicator Refining Margin (GIM)b
Northwest Europe 3.92 5.47 4.28
US Gulf Coast 12.00 11.40 7.15
Midwest 9.14 8.19 5.08
US West Coast 14.84 13.49 11.27
Singapore 4.22 5.56 4.94
BP average 8.39 8.60 6.31
%
------------------------------------------------------------------------------------------------------------------------------------------------------------------------------------------------------------------------------------------------------------------------------------------------------------
Refining availabilityc82.5 92.9 95.4
mb/d
------------------------------------------------------------------------------------------------------------------------------------------------------------------------------------------------------------------------------------------------------------------------------------------------------------
Refinery throughputs 2,198 2,399 2,607
aIncludes profit after interest and tax of equity-accounted entities.
bThe GIM is the average of regional industry indicator margins that we weight for BP’s crude refining capacity in each region. Each regional indicator margin is based on a
single representative crude with product yields characteristic of the typical level of upgrading complexity. The refining margins are industry-specific rather than BP-specific
measures, which we believe are useful to investors in analysing trends in the industry and their impact on our results. The margins are calculated by BP based on published
crude oil and product prices and take account of fuel utilization and catalyst costs. No account is taken of BP’s other cash and non-cash costs of refining, such as wages and
salaries and plant depreciation. The indicator margin may not be representative of the margins achieved by BP in any period because of BP’s particular refining configurations
and crude and product slate.
cRefining availability is defined as the ratio of units that are available for processing, regardless of whether they are actually being used, to total capacity. Where there is
planned maintenance, such capacity is not regarded as being available. During 2006, there was planned maintenance of a substantial part of the Texas City refinery.
BP Annual Report and Accounts 2006 51