BP 2006 Annual Report Download - page 123
Download and view the complete annual report
Please find page 123 of the 2006 BP annual report below. You can navigate through the pages in the report by either clicking on the pages listed below, or by using the keyword search tool below to find specific information within the annual report.-
 1
1 -
2
-
3
-
4
-
5
-
6
-
7
-
8
-
9
-
10
-
11
-
12
-
13
-
14
-
15
-
16
-
17
-
18
-
19
-
20
-
21
-
22
-
23
-
24
-
25
-
26
-
27
-
28
-
29
-
30
-
31
-
32
-
33
-
34
-
35
-
36
-
37
-
38
-
39
-
40
-
41
-
42
-
43
-
44
-
45
-
46
-
47
-
48
-
49
-
50
-
51
-
52
-
53
-
54
-
55
-
56
-
57
-
58
-
59
-
60
-
61
-
62
-
63
-
64
-
65
-
66
-
67
-
68
-
69
-
70
-
71
-
72
-
73
-
74
-
75
-
76
-
77
-
78
-
79
-
80
-
81
-
82
-
83
-
84
-
85
-
86
-
87
-
88
-
89
-
90
-
91
-
92
-
93
-
94
-
95
-
96
-
97
-
98
-
99
-
100
-
101
-
102
-
103
-
104
-
105
-
106
-
107
-
108
-
109
-
110
-
111
-
112
-
 113
113 -
 114
114 -
 115
115 -
 116
116 -
 117
117 -
 118
118 -
 119
119 -
 120
120 -
 121
121 -
 122
122 -
 123
123 -
 124
124 -
 125
125 -
 126
126 -
 127
127 -
 128
128 -
 129
129 -
 130
130 -
 131
131 -
 132
132 -
 133
133 -
134
-
135
-
136
-
137
-
138
-
139
-
140
-
141
-
142
-
143
-
144
-
145
-
146
-
147
-
148
-
149
-
150
-
151
-
152
-
153
-
154
-
155
-
156
-
157
-
158
-
159
-
160
-
161
-
162
-
163
-
164
-
165
-
166
-
167
-
168
-
169
-
170
-
171
-
172
-
173
-
174
-
175
-
176
-
177
-
178
-
179
-
180
-
181
-
182
-
183
-
184
-
185
-
186
-
187
-
188
-
189
-
190
-
191
-
192
-
193
-
194
-
195
-
196
-
197
-
198
-
199
-
200
-
201
-
202
-
203
-
204
-
205
-
206
-
207
-
208
-
209
-
210
-
211
-
212
-
213
-
214
-
215
-
216
-
217
-
218
-
219
-
220
-
221
-
222
-
223
-
224
-
225
-
226
-
227
-
228
 |
 |

BP Annual Report and Accounts 2006 121
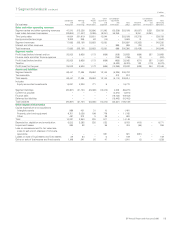
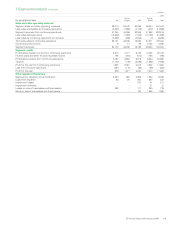
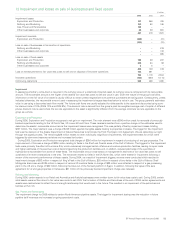
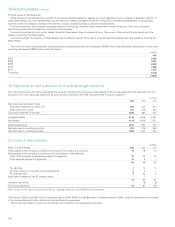
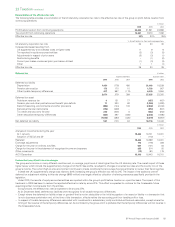
10 Gains on sale of businesses and fixed assets
$ million
------------------------------------------------------------------------------------------------------------------------------------------------------------------------------------------------------------------------------------------------------------------------------------------------------------
2006 2005 2004
------------------------------------------------------------------------------------------------------------------------------------------------------------------------------------------------------------------------------------------------------------------------------------------------------------
Gains on sale of businesses
Refining and Marketing 104 18 –
Other businesses and corporate 63 ––
------------------------------------------------------------------------------------------------------------------------------------------------------------------------------------------------------------------------------------------------------------------------------------------------------------
167 18 –
------------------------------------------------------------------------------------------------------------------------------------------------------------------------------------------------------------------------------------------------------------------------------------------------------------
Gains on sale of fixed assets
Exploration and Production 2,309 1,198 162
Refining and Marketing 1,008 223 104
Gas, Power and Renewables 193 55 56
Other businesses and corporate 37 47 1,365
------------------------------------------------------------------------------------------------------------------------------------------------------------------------------------------------------------------------------------------------------------------------------------------------------------
3,547 1,523 1,687
------------------------------------------------------------------------------------------------------------------------------------------------------------------------------------------------------------------------------------------------------------------------------------------------------------
3,714 1,541 1,687
Innovene operations –(3) (2)
------------------------------------------------------------------------------------------------------------------------------------------------------------------------------------------------------------------------------------------------------------------------------------------------------------
Continuing operations 3,714 1,538 1,685
The principal transactions giving rise to these gains for each business segment are described below.
Exploration and Production
The group divested interests in a number of oil and natural gas properties in all three years. The major divestments during 2006 that resulted in gains
were the sales of our interest in the Shenzi discovery in the Gulf of Mexico in the US and interests in the North Sea. In 2005 the major divestment was
the sale of the group’s interest in the Ormen Lange field in Norway. BP also sold various oil and gas properties in Trinidad & Tobago, Canada and the
Gulf of Mexico. For 2004, divestments included interests in oil and natural gas properties in Australia, Canada and the Gulf of Mexico.
Refining and Marketing
During 2006, the group divested its retail business in the Czech Republic and fixed assets including its shareholding in Zhenhai Refining and Chemicals
Company in China, its shareholding in Eiffage, the French-based construction company, and pipeline assets. In 2005, the group divested a number of
regional retail networks in the US. For 2004, divestments included the sale of the Cushing and other pipeline interests in the US and the churn of retail
assets.
Gas, Power and Renewables
In 2006, the group divested its shareholding in Enagas. In 2005, transactions included the disposal of the group’s interest in the Interconnector pipeline
and power plant at Great Yarmouth in the UK. During 2004, the group divested its interest in two natural gas liquids plants in Canada.
Other businesses and corporate
In 2006, the group disposed of its ethylene oxide business. For 2004, the major disposals were the divestment of the group’s investments in
PetroChina and Sinopec.
Additional information on the sale of businesses and fixed assets is given in Note 6.
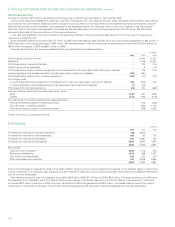
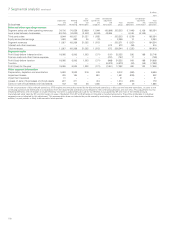
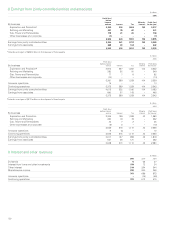
11 Production and similar taxes
$ million
------------------------------------------------------------------------------------------------------------------------------------------------------------------------------------------------------------------------------------------------------------------------------------------------------------
2006 2005 2004
------------------------------------------------------------------------------------------------------------------------------------------------------------------------------------------------------------------------------------------------------------------------------------------------------------
UK 260 495 335
Overseas 3,361 2,515 1,814
------------------------------------------------------------------------------------------------------------------------------------------------------------------------------------------------------------------------------------------------------------------------------------------------------------
3,621 3,010 2,149