Airtran 2010 Annual Report Download - page 99
Download and view the complete annual report
Please find page 99 of the 2010 Airtran annual report below. You can navigate through the pages in the report by either clicking on the pages listed below, or by using the keyword search tool below to find specific information within the annual report.-
 1
1 -
2
-
3
-
4
-
5
-
6
-
7
-
8
-
9
-
10
-
11
-
12
-
13
-
14
-
15
-
16
-
17
-
18
-
19
-
20
-
21
-
22
-
23
-
24
-
25
-
26
-
27
-
28
-
29
-
30
-
31
-
32
-
33
-
34
-
35
-
36
-
37
-
38
-
39
-
40
-
41
-
42
-
43
-
44
-
45
-
46
-
47
-
48
-
49
-
50
-
51
-
52
-
53
-
54
-
55
-
56
-
57
-
58
-
59
-
60
-
61
-
62
-
63
-
64
-
65
-
66
-
67
-
68
-
69
-
70
-
71
-
72
-
73
-
74
-
75
-
76
-
77
-
78
-
79
-
80
-
81
-
82
-
83
-
84
-
85
-
86
-
87
-
88
-
 89
89 -
 90
90 -
 91
91 -
 92
92 -
 93
93 -
 94
94 -
 95
95 -
 96
96 -
 97
97 -
 98
98 -
 99
99 -
 100
100 -
 101
101 -
 102
102 -
 103
103 -
 104
104 -
 105
105 -
 106
106 -
 107
107 -
 108
108 -
 109
109 -
110
-
111
-
112
-
113
-
114
-
115
-
116
-
117
-
118
-
119
-
120
-
121
-
122
-
123
-
124
-
125
-
126
-
127
-
128
-
129
-
130
-
131
-
132
-
133
-
134
-
135
-
136
-
137
 |
 |
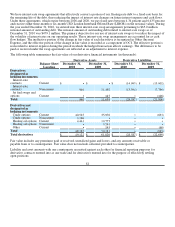
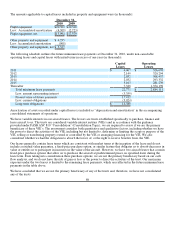
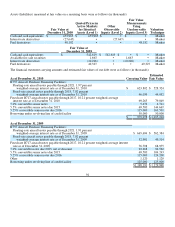
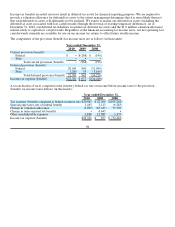
Assets (liabilities) measured at fair value on a recurring basis were as follows (in thousands):
Fair Value at
December 31, 2010
Quoted Prices in
Active Markets
for Identical
Assets (Level 1)
Other
Observable
Inputs (Level 2)
Fair Value
Measurements
Using
Unobservable
Inputs (Level 3) Valuation
Technique
Cash and cash equivalents $ 453,965 $ 453,965 $ • $ • Market
Interest rate derivatives (27,647) • (27,647) • Market
Fuel derivatives 48,182 • • 48,182 Market
Fair Value at
December 31, 2009
Cash and cash equivalents $ 542,619 $ 542,619 $ • $ • Market
Available-for-sale securities 1,663 • 1,663 • Market
Interest rate derivatives (10,206) • (10,206) • Market
Fuel derivatives 49,327 • • 49,327 Market
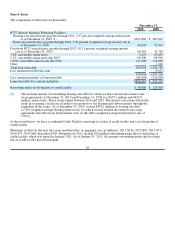
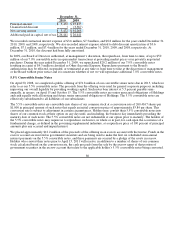
The financial statement carrying amounts and estimated fair values of our debt were as follows (in thousands):
As of December 31, 2010 Carrying Value Estimated
Fair Value
B737 Aircraft Purchase Financing Facilities:
Floating-rate aircraft notes payable through 2021, 1.97 percent
weighted-average interest rate as of December 31, 2010 $ 623,802 $ 528,324
Fixed-rate aircraft notes payable through 2018, 7.02 percent
weighted-average interest rate as of December 31, 2010 46,039 44,952
Fixed-rate B717 aircraft notes payable through 2017, 10.21 percent weighted-average
interest rate as of December 31, 2010 69,265 79,049
7.0% convertible senior notes 5,472 4,711
5.5% convertible senior notes due 2015 69,500 144,667
5.25% convertible senior notes due 2016 115,000 163,501
Borrowing under revolving line of credit facility 50,000 50,000
$ 979,078 $ 1,015,204
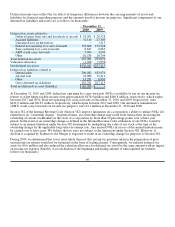
As of December 31, 2009
B737 Aircraft Purchase Financing Facilities:
Floating-rate aircraft notes payable through 2021, 1.91 percent
weighted-average interest rate as of December 31, 2009 $ 665,694 $ 562,384
Fixed-rate aircraft notes payable through 2018, 7.02 percent
weighted-average interest rate as of December 31, 2009 52,901 49,514
Fixed-rate B717 aircraft notes payable through 2017, 10.21 percent weighted-average interest
rate as of December 31, 2009 76,708 68,975
7.0% convertible notes due 2023, net of discount 92,268 94,562
5.5% convertible senior notes due 2015 69,500 104,243
5.25% convertible senior notes due 2016 115,000 124,200
Other 1,120 1,120
Borrowing under revolving line of credit facility 125,000 125,000
$1,198,191 $ 1,129,998
91