Air New Zealand 2015 Annual Report Download - page 47
Download and view the complete annual report
Please find page 47 of the 2015 Air New Zealand annual report below. You can navigate through the pages in the report by either clicking on the pages listed below, or by using the keyword search tool below to find specific information within the annual report.-
 1
1 -
2
-
3
-
4
-
5
-
6
-
7
-
8
-
9
-
10
-
11
-
12
-
13
-
14
-
15
-
16
-
17
-
18
-
19
-
20
-
21
-
22
-
23
-
24
-
25
-
26
-
27
-
28
-
29
-
30
-
31
-
32
-
33
-
34
-
35
-
36
-
 37
37 -
 38
38 -
 39
39 -
 40
40 -
 41
41 -
 42
42 -
 43
43 -
 44
44 -
 45
45 -
 46
46 -
 47
47 -
 48
48 -
 49
49 -
 50
50 -
 51
51 -
 52
52 -
 53
53 -
 54
54 -
 55
55 -
 56
56 -
 57
57 -
58
-
59
-
60
-
61
-
62
-
63
-
64
-
65
-
66
-
67
-
68
 |
 |

Air New Zealand Annual Financial Results 2015 45
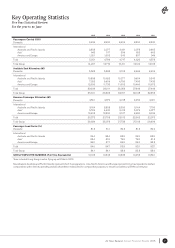
Key Operating Statistics
Five Year Statistical Review
For the year to 30 June
2015 2014 2013 2012 2 011
Passengers Carried (000)
Domestic 9,246 8,920 8,694 8,500 8,530
International
Australia and Pacific Islands
Asia*
America and Europe
3,388
642
1,021
3,277
517
1,005
3,181
596
940
3,073
652
897
2,965
662
946
Total 5,051 4,799 4,717 4,622 4,573
Total Group 14,297 13,719 13 , 411 13,122 13,103
Available Seat Kilometres (M)
Domestic 5,592 5,385 5,108 4,969 4,904
International
Australia and Pacific Islands
Asia*
America and Europe
10,888
7,022
12,099
10,622
5,656
11,73 3
10,277
6,780
11, 0 0 2
9,694
7,495
10,460
9,345
7,432
10,672
Total 30,009 2 8 , 011 28,059 27,649 27,449
Total Group 35,601 33,396 33,167 32,618 32,353
Revenue Passenger Kilometres (M)
Domestic 4,561 4,370 4,218 4,050 4,021
International
Australia and Pacific Islands
Asia*
America and Europe
9,184
5,784
10,405
8,858
4,630
10,220
8,580
5,418
9,517
8,164
5,979
8,820
7,799
6,077
9,099
Total 25,373 23,708 23,515 22,963 22,975
Total Group 29,934 28,078 27,733 27,013 26,996
Passenger Load Factor (%)
Domestic 81.6 81.1 82.6 81.5 82.0
International
Australia and Pacific Islands
Asia*
America and Europe
84.4
82.4
86.0
83.4
81.9
87.1
83.5
79.9
86.5
84.2
79.8
84.3
83.5
81.8
85.3
Total 84.6 84.7 83.8 83.1 83.7
Total Group 84.1 84.1 83.6 82.8 83.4
GROUP EMPLOYEE NUMBERS (Full Time Equivalents) 10,196 10,546 10,336 10,453 10,861
*Asia included Hong Kong-London flying up until March 2013.
New Zealand, Australia and Pacific Islands represent short-haul operations. Asia, North America and Europe represent long-haul operations Certain
comparatives within the key operating statistics have been reclassified for comparative purposes, to ensure consistency with the current year.