Air New Zealand 2015 Annual Report Download - page 19
Download and view the complete annual report
Please find page 19 of the 2015 Air New Zealand annual report below. You can navigate through the pages in the report by either clicking on the pages listed below, or by using the keyword search tool below to find specific information within the annual report.-
 1
1 -
2
-
3
-
4
-
5
-
6
-
7
-
8
-
 9
9 -
 10
10 -
 11
11 -
 12
12 -
 13
13 -
 14
14 -
 15
15 -
 16
16 -
 17
17 -
 18
18 -
 19
19 -
 20
20 -
 21
21 -
 22
22 -
 23
23 -
 24
24 -
 25
25 -
 26
26 -
 27
27 -
 28
28 -
 29
29 -
30
-
31
-
32
-
33
-
34
-
35
-
36
-
37
-
38
-
39
-
40
-
41
-
42
-
43
-
44
-
45
-
46
-
47
-
48
-
49
-
50
-
51
-
52
-
53
-
54
-
55
-
56
-
57
-
58
-
59
-
60
-
61
-
62
-
63
-
64
-
65
-
66
-
67
-
68
 |
 |
Notes to the Financial Statements (continued)
As at 30 June 2015
Air New Zealand Annual Financial Results 2015 17
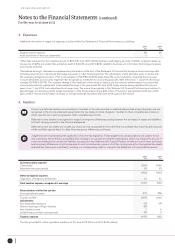
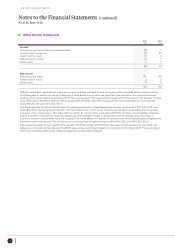
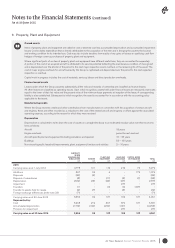
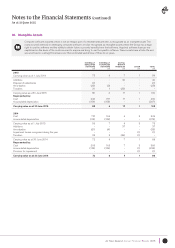
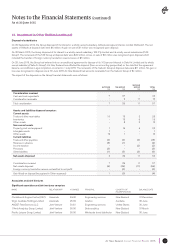
10. Intangible Assets
Computer software acquired, which is not an integral part of a related hardware item, is recognised as an intangible asset. The
costs incurred internally in developing computer software are also recognised as intangible assets where the Group has a legal
right to use the software and the ability to obtain future economic benefits from that software. Acquired software licences are
capitalised on the basis of the costs incurred to acquire and bring to use the specific software. These assets have a finite life and
are amortised on a straight-line basis over their estimated useful lives of three to six years.
INTE R NALLY
DEVELOPED
SOFTWARE
$M
EXTE R NALLY
PURCHASED
SOFTWARE
$M
CAPITAL
WORK IN
PROGRESS
$M
OTHER
$M
TOTAL
$M
2015
Carrying value as at 1 July 2014
72 6
7 1
86
Additions
Disposal of subsidiaries
Amortisation
Transfers
-
(1)
(22)
31
-
-
(3)
1
42
-
-
(32)
-
-
-
-
42
(1)
(25)
-
Carrying value as at 30 June 2015
Represented by:
Cost
Accumulated depreciation
80
234
(154)
4
157
(153)
17
17
-
1
1
-
102
409
(307)
Carrying value as at 30 June 2015 80 417 1102
2014
Cost
Accumulated depreciation
174
(115 )
166
(159)
6
-
3
-
349
(274)
Carrying value as at 1 July 2013
Additions
Amortisation
Impairment losses recognised during the year
Transfers
59
-
(21)
-
34
7
-
(4)
-
3
6
37
-
-
(36)
3
-
-
(1)
(1)
75
37
(25)
(1)
-
Carrying value as at 30 June 2014
Represented by:
Cost
Accumulated depreciation
Provision for impairment
72
205
(133)
-
6
165
(159)
-
7
7
-
-
1
3
(1)
(1)
86
380
(293)
(1)
Carrying value as at 30 June 2014 72 67186