Air New Zealand 2015 Annual Report Download - page 4
Download and view the complete annual report
Please find page 4 of the 2015 Air New Zealand annual report below. You can navigate through the pages in the report by either clicking on the pages listed below, or by using the keyword search tool below to find specific information within the annual report.-
 1
1 -
 2
2 -
 3
3 -
 4
4 -
 5
5 -
 6
6 -
 7
7 -
 8
8 -
 9
9 -
 10
10 -
 11
11 -
 12
12 -
 13
13 -
 14
14 -
 15
15 -
16
-
17
-
18
-
19
-
20
-
21
-
22
-
23
-
24
-
25
-
26
-
27
-
28
-
29
-
30
-
31
-
32
-
33
-
34
-
35
-
36
-
37
-
38
-
39
-
40
-
41
-
42
-
43
-
44
-
45
-
46
-
47
-
48
-
49
-
50
-
51
-
52
-
53
-
54
-
55
-
56
-
57
-
58
-
59
-
60
-
61
-
62
-
63
-
64
-
65
-
66
-
67
-
68
 |
 |

AIR NEW ZEALAND GROUP
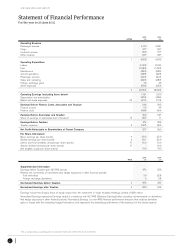
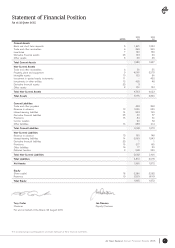
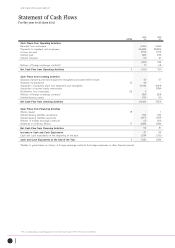
The accompanying accounting policies and notes form part of these financial statements.
2
NOTES
2015
$M
2014
$M
Operating Revenue
Passenger revenue
Cargo
Contract services
Other revenue
4 ,113
317
258
237
3,851
287
277
237
Operating Expenditure
Labour
Fuel
Maintenance
Aircraft operations
Passenger services
Sales and marketing
Foreign exchange gains
Other expenses
1 4,925
(1,193)
(1,089)
(320)
(466)
(220)
(303)
79
(252)
4,652
(1,151)
(1,120)
(285)
(424)
(212)
(280)
45
(222)
2(3,764) (3,649)
Operating Earnings (excluding items below)
Depreciation and amortisation
Rental and lease expenses 20
1,161
(402)
( 211)
1,003
(436)
(174)
Earnings Before Finance Costs, Associates and Taxation
Finance income
Finance costs
548
56
(108)
393
44
(90)
Earnings Before Associates and Taxation
Share of earnings of associates (net of taxation) 12
496
(22)
347
11
Earnings Before Taxation
Taxation expense 3
474
(147)
358
(95)
Net Profit Attributable to Shareholders of Parent Company 327 263
Per Share Information:
Basic earnings per share (cents)
Diluted earnings per share (cents)
Interim and final dividends declared per share (cents)
Special dividend declared per share (cents)
Net tangible assets per share (cents)
4
4
17
17
29.2
29.1
16.0
-
166
23.9
23.6
10.0
10.0
160
NOTE
2015
$M
2014
$M
Supplementary Information
Earnings before Taxation (per NZ IFRS above)
Reverse net movements on derivatives that hedge exposures in other financial periods:
Fuel derivatives
Foreign exchange derivatives
474
20
2
358
(23)
(3)
Normalised Earnings before Taxation 2496 332
Normalised Earnings after Taxation 2343 244
Earnings include the Group’s share of equity losses from the investment in Virgin Australia Holdings Limited of $29 million.
Normalised Earnings represents Earnings stated in compliance with NZ IFRS (Statutory Earnings) after excluding net movements on derivatives
that hedge exposures in other financial periods. Normalised Earnings is a non-IFRS financial performance measure that matches derivative
gains or losses with the underlying hedged transaction, and represents the underlying performance of the business for the relevant period.
Statement of Financial Performance
For the year to 30 June 2015