Air New Zealand 2015 Annual Report Download - page 38
Download and view the complete annual report
Please find page 38 of the 2015 Air New Zealand annual report below. You can navigate through the pages in the report by either clicking on the pages listed below, or by using the keyword search tool below to find specific information within the annual report.-
 1
1 -
2
-
3
-
4
-
5
-
6
-
7
-
8
-
9
-
10
-
11
-
12
-
13
-
14
-
15
-
16
-
17
-
18
-
19
-
20
-
21
-
22
-
23
-
24
-
25
-
26
-
27
-
 28
28 -
 29
29 -
 30
30 -
 31
31 -
 32
32 -
 33
33 -
 34
34 -
 35
35 -
 36
36 -
 37
37 -
 38
38 -
 39
39 -
 40
40 -
 41
41 -
 42
42 -
 43
43 -
 44
44 -
 45
45 -
 46
46 -
 47
47 -
 48
48 -
49
-
50
-
51
-
52
-
53
-
54
-
55
-
56
-
57
-
58
-
59
-
60
-
61
-
62
-
63
-
64
-
65
-
66
-
67
-
68
 |
 |

AIR NEW ZEALAND GROUP
Notes to the Financial Statements (continued)
As at 30 June 2015
36
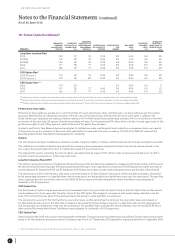
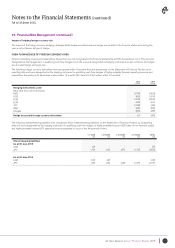
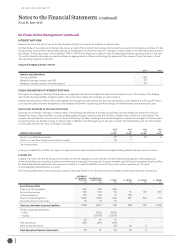
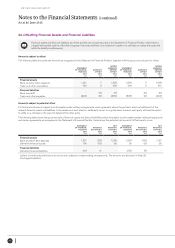
23. Financial Risk Management (continued)
INTEREST RATE RISK
Interest rate risk is the risk of loss to Air New Zealand arising from adverse fluctuations in interest rates.
Air New Zealand has exposure to interest rate risk as a result of the long-term borrowing activities which are used to fund ongoing activities. It is the
Group’s policy to ensure the interest rate exposure is maintained to minimise the impact of changes in interest rates on its net floating rate long-term
borrowings. The Group’s policy is to fix between 70% to 100% of its exposure to interest rates, including fixed interest operating leases, in the next
12 months. Interest rate swaps are used to achieve an appropriate mix of fixed and floating rate exposure if the volume of fixed rate loans or fixed
rate operating leases is insufficient.
Impact of hedging interest rate risk
2015 2014
Interest rate derivatives
Volume (USD M)
Weighted average contract rate (%)
Weighted average contract maturities (years)
150
1.7
4.4
-
-
-
CASH FLOW HEDGES OF INTEREST RATE RISK
The impact of changes in floating interest rates is recognised in the financial statements when the transactions occur. The volume of the floating
rate interest-bearing liabilities hedged, together with and contract rates and maturities are set out above.
Interest rate derivatives of $0.4 million (net liability) were recognised within ‘Derivative financial instruments’ on the Statement of Financial Position
as at reporting date and were designated as the hedging instrument in qualifying cash flow hedges. No ineffectiveness arose during the year.
Interest rate sensitivity on financial instruments
Earnings are sensitive to changes in interest rates on the floating rate element of borrowings and finance lease obligations and the fair value of
interest rate swaps. Their sensitivity to a reasonably possible change in interest rates with all other variables held constant, is set out below. This
analysis assumes that the amount and mix of fixed and floating rate debt, including finance lease obligations, remains unchanged from that in place
at reporting date, and that the change in interest rates is effective from the beginning of the year. In reality, the fixed/floating rate mix will fluctuate
over the year and interest rates will change continually.
Interest rate change:
2015
$M
+50 bp*
2015
$M
-50 bp*
2014
$M
+50 bp*
2014
$M
-50 bp*
Impact on profit before taxation
Impact on cash flow hedge reserve (within equity)
(7)
(1)
7
1
(5)
-
5
-
*bp = basis points
In the year ended 30 June 2015, the impact on equity as shown above would be offset by the hedged floating interest rate exposure as it occurs.
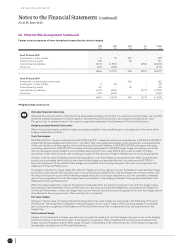
Liquidity risk
Liquidity risk is the risk that the Group will be unable to meet its obligations as they fall due. Air New Zealand manages the risk by targeting a
minimum liquidity level, ensuring long term commitments are managed with respect to forecast available cash inflow and managing maturity profiles.
Air New Zealand holds significant cash reserves to enable it to meet its liabilities as they fall due and to sustain operations in the event
of unanticipated external factors or events.
The following table sets out the contractual, undiscounted cash flows for non-derivative financial liabilities and derivative financial instruments:
STATEMENT
OF FINANCIAL
POSITION
$M
CONTRACTUAL
CASH FLOWS
$M
< 1 YEAR
$M
1-2 YEARS
$M
2-5 YEARS
$M
5+ YEARS
$M
As at 30 June 2015
Trade and other payables
Secured borrowings
Unsecured bonds
Finance lease obligations
Amounts owing to associates
448
512
150
1,660
18
448
562
166
1,823
18
448
54
10
238
18
-
51
156
251
-
-
147
-
615
-
-
310
-
719
-
Total non-derivative financial liabilities 2,788 3,017 768 458 762 1,029
Foreign exchange derivatives
– Inflow
– Outflow
2,090
(2,013)
2,090
(2,013)
-
-
-
-
-
-
Fuel derivatives
Interest rate derivatives
87
(22)
-
77
(26)
-
77
(26)
(2)
-
-
(1)
-
-
3
-
-
-
Total derivative financial instruments 65 51 49 (1) 3 -