Air New Zealand 2015 Annual Report Download - page 13
Download and view the complete annual report
Please find page 13 of the 2015 Air New Zealand annual report below. You can navigate through the pages in the report by either clicking on the pages listed below, or by using the keyword search tool below to find specific information within the annual report.-
 1
1 -
2
-
 3
3 -
 4
4 -
 5
5 -
 6
6 -
 7
7 -
 8
8 -
 9
9 -
 10
10 -
 11
11 -
 12
12 -
 13
13 -
 14
14 -
 15
15 -
 16
16 -
 17
17 -
 18
18 -
 19
19 -
 20
20 -
 21
21 -
 22
22 -
 23
23 -
24
-
25
-
26
-
27
-
28
-
29
-
30
-
31
-
32
-
33
-
34
-
35
-
36
-
37
-
38
-
39
-
40
-
41
-
42
-
43
-
44
-
45
-
46
-
47
-
48
-
49
-
50
-
51
-
52
-
53
-
54
-
55
-
56
-
57
-
58
-
59
-
60
-
61
-
62
-
63
-
64
-
65
-
66
-
67
-
68
 |
 |

Notes to the Financial Statements (continued)
For the year to and as at 30 June 2015
Air New Zealand Annual Financial Results 2015 11
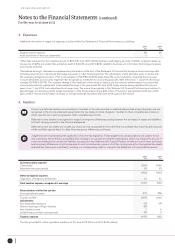
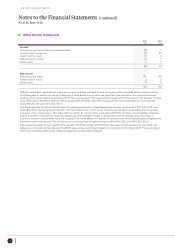
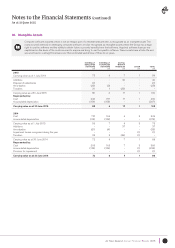
3. Taxation (continued)
Deferred taxation
Deferred tax assets and liabilities are attributable to the following:
NON-AIRCRAFT
ASSETS
$M
AIRCRAFT
REL ATED
$M
PROVISIONS
AND
ACCRUALS
$M
FINANCIAL
INSTRUMENTS
$M
PENSION
OBLIGATIONS
$M
TOTAL
$M
As at 1 July 2013
Amounts recognised in equity
Amounts recognised in earnings
23
-
(8)
334
-
(32)
(77)
-
(21)
30
(18)
-
(5)
3
-
305
(15)
(61)
As at 30 June 2014 15 302 (98) 12 (2) 229
Amounts recognised in equity
Reclassified from Income Taxation
Amounts recognised in earnings
-
-
(1)
-
-
(3)
-
-
(8)
9
2
-
-
-
-
9
2
(12)
As at 30 June 2015 14 299 (106) 23 (2) 228
Deferred tax assets and liabilities are offset on the face of the Statement of Financial Position where they relate to entities within the same
taxation authority.
There are no unused tax losses available to carry forward against future taxable profits (30 June 2014: Nil).
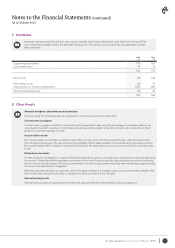
4. Earnings per Share
Basic earnings per share is calculated by dividing the profit attributable to shareholders of the company by the weighted average
number of ordinary shares on issue during the year, excluding shares held as treasury stock. Diluted earnings per share assumes
conversion of all dilutive potential ordinary shares in determining the denominator.
2015
$M
2014
$M
Earnings for the purpose of basic and diluted earnings per share:
Net Profit Attributable to Shareholders of the Parent Company 327 263
Weighted average number of shares (in millions of shares)
Weighted average number of Ordinary Shares for basic earnings per share
Effect of dilutive ordinary shares:
- Share options and performance rights
1,118
6
1,101
11
Weighted average number of Ordinary Shares for diluted earnings per share 1,124 1,112
Basic earnings per share
Diluted earnings per share
29.2
29.1
23.9
23.6