Air New Zealand 2015 Annual Report Download - page 14
Download and view the complete annual report
Please find page 14 of the 2015 Air New Zealand annual report below. You can navigate through the pages in the report by either clicking on the pages listed below, or by using the keyword search tool below to find specific information within the annual report.-
 1
1 -
2
-
3
-
 4
4 -
 5
5 -
 6
6 -
 7
7 -
 8
8 -
 9
9 -
 10
10 -
 11
11 -
 12
12 -
 13
13 -
 14
14 -
 15
15 -
 16
16 -
 17
17 -
 18
18 -
 19
19 -
 20
20 -
 21
21 -
 22
22 -
 23
23 -
 24
24 -
25
-
26
-
27
-
28
-
29
-
30
-
31
-
32
-
33
-
34
-
35
-
36
-
37
-
38
-
39
-
40
-
41
-
42
-
43
-
44
-
45
-
46
-
47
-
48
-
49
-
50
-
51
-
52
-
53
-
54
-
55
-
56
-
57
-
58
-
59
-
60
-
61
-
62
-
63
-
64
-
65
-
66
-
67
-
68
 |
 |

AIR NEW ZEALAND GROUP
Notes to the Financial Statements (continued)
For the year to and as at 30 June 2015
12
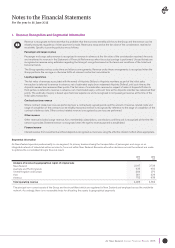
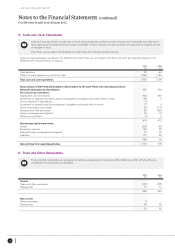
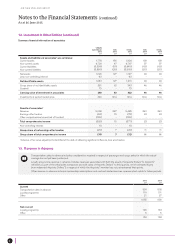
5. Cash and Cash Equivalents
Cash and cash equivalents include cash on hand, demand deposits, current accounts in banks net of overdrafts and other short-
term highly liquid investments that are readily convertible to known amounts of cash and which are subject to an insignificant risk
of changes in value.
Cash flows are included in the Statement of Cash Flows net of Goods and Services Tax.
Cash and cash equivalents, as stated in the Statement of Cash Flows, are reconciled to the Bank and short term deposits balance in the
Statement of Financial Position as follows:
2015
$M
2014
$M
Cash balances
Other short term deposits and short term bills
22
1,299
68
1,166
Total cash and cash equivalents 1,321 1,234
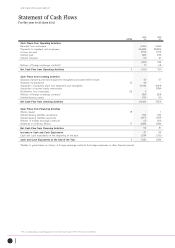
Reconciliation of Net Profit Attributable to Shareholders to Net Cash Flows from Operating Activities:
Net profit attributable to shareholders
Plus/(less) non-cash items:
Depreciation and amortisation
(Gain)/loss on disposal of property, plant and equipment, intangibles and assets held for resale
Loss on disposal of subsidiaries
Impairment on property, plant and equipment, intangibles and assets held for resale
Share of earnings of associates
Movements on fuel derivatives
Foreign exchange losses/(gains)
Other non-cash items
327
402
(2)
4
17
22
20
16
8
263
436
2
-
4
(11)
(25)
(1)
4
Net working capital movements:
Assets
Revenue in advance
Deferred foreign exchange losses/(gains)
Liabilities
814
(38)
136
17
171
672
(6)
20
(4)
48
286 58
Net cash flow from operating activities 1,100 730
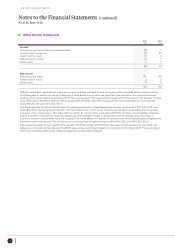
6. Trade and Other Receivables
Trade and other receivables are recognised at cost less any provision for impairment. Bad debts are written-off when they are
considered to have become uncollectable.
2015
$M
2014
$M
Current
Trade and other receivables
Prepayments
298
71
298
51
369 349
Non-current
Other receivables
Prepayments
3
48
-
55
51 55