Westjet 2015 Annual Report Download - page 95
Download and view the complete annual report
Please find page 95 of the 2015 Westjet annual report below. You can navigate through the pages in the report by either clicking on the pages listed below, or by using the keyword search tool below to find specific information within the annual report.-
 1
1 -
2
-
3
-
4
-
5
-
6
-
7
-
8
-
9
-
10
-
11
-
12
-
13
-
14
-
15
-
16
-
17
-
18
-
19
-
20
-
21
-
22
-
23
-
24
-
25
-
26
-
27
-
28
-
29
-
30
-
31
-
32
-
33
-
34
-
35
-
36
-
37
-
38
-
39
-
40
-
41
-
42
-
43
-
44
-
45
-
46
-
47
-
48
-
49
-
50
-
51
-
52
-
53
-
54
-
55
-
56
-
57
-
58
-
59
-
60
-
61
-
62
-
63
-
64
-
65
-
66
-
67
-
68
-
69
-
70
-
71
-
72
-
73
-
74
-
75
-
76
-
77
-
78
-
79
-
80
-
81
-
82
-
83
-
84
-
 85
85 -
 86
86 -
 87
87 -
 88
88 -
 89
89 -
 90
90 -
 91
91 -
 92
92 -
 93
93 -
 94
94 -
 95
95 -
 96
96 -
 97
97 -
 98
98 -
 99
99 -
 100
100 -
 101
101
 |
 |

Notes to Consolidated Financial Statements
As at and for the years ended December 31, 2015 and 2014
(Stated in thousands of Canadian dollars, except percentage, ratio, share and per share amounts)
WestJet Annual Report 2015 | 93
14. Financial instruments and risk management (continued)
(b) Risk management related to financial instruments (continued)
Liquidity risk
Liquidity risk is the risk that the Corporation will encounter difficulty in meeting obligations associated with financial liabilities.
The Corporation maintains a strong liquidity position and sufficient financial resources to meet its obligations as they fall due.
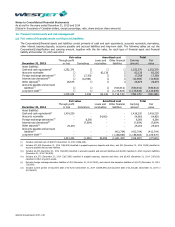
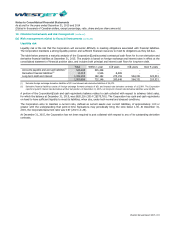
The table below presents a maturity analysis of the Corporation’s undiscounted contractual cash flows for its non-derivative and
derivative financial liabilities at December 31, 2015. The analysis is based on foreign exchange and interest rates in effect at the
consolidated statement of financial position date, and includes both principal and interest cash flows for long-term debt.
Total
Within 1 year
1–3 years
3–5 years
Over 5 years
Accounts payable and accrued liabilities(i)
545,438
545,438
−
−
−
Derivative financial liabilities(ii)
13,015
4,526
8,489
−
−
Long-term debt and interest
1,342,203
182,182
275,159
564,331
320,531
1,900,656
732,146
283,648
564,331
320,531
(i) Excludes foreign exchange derivative liabilities of $51 and interest rate derivative liabilities of $4,475.
(ii) Derivative financial liabilities consist of foreign exchange forward contracts of $51 and interest rate derivative contracts of $12,964. The Corporation
reports long-term interest rate derivatives at their net position. At December 31, 2015, net long-term interest rate derivative liabilities were $8,489.
A portion of the Corporation’s cash and cash equivalents balance relates to cash collected with respect to advance ticket sales,
for which the balance at December 31, 2015, was $620,216 (2014 – $575,781). The Corporation has cash and cash equivalents
on hand to have sufficient liquidity to meet its liabilities, when due, under both normal and stressed conditions.
The Corporation aims to maintain a current ratio, defined as current assets over current liabilities, of approximately 1.00 or
greater with the understanding that point-in-time fluctuations may periodically bring the ratio below 1.00. At December 31,
2015, the Corporation’s current ratio was 0.97 (2014 – 1.29).
At December 31, 2015, the Corporation has not been required to post collateral with respect to any of its outstanding derivative
contracts.