Westjet 2015 Annual Report Download - page 32
Download and view the complete annual report
Please find page 32 of the 2015 Westjet annual report below. You can navigate through the pages in the report by either clicking on the pages listed below, or by using the keyword search tool below to find specific information within the annual report.-
 1
1 -
2
-
3
-
4
-
5
-
6
-
7
-
8
-
9
-
10
-
11
-
12
-
13
-
14
-
15
-
16
-
17
-
18
-
19
-
20
-
21
-
 22
22 -
 23
23 -
 24
24 -
 25
25 -
 26
26 -
 27
27 -
 28
28 -
 29
29 -
 30
30 -
 31
31 -
 32
32 -
 33
33 -
 34
34 -
 35
35 -
 36
36 -
 37
37 -
 38
38 -
 39
39 -
 40
40 -
 41
41 -
 42
42 -
43
-
44
-
45
-
46
-
47
-
48
-
49
-
50
-
51
-
52
-
53
-
54
-
55
-
56
-
57
-
58
-
59
-
60
-
61
-
62
-
63
-
64
-
65
-
66
-
67
-
68
-
69
-
70
-
71
-
72
-
73
-
74
-
75
-
76
-
77
-
78
-
79
-
80
-
81
-
82
-
83
-
84
-
85
-
86
-
87
-
88
-
89
-
90
-
91
-
92
-
93
-
94
-
95
-
96
-
97
-
98
-
99
-
100
-
101
 |
 |

WestJet Annual Report 2015 | 30
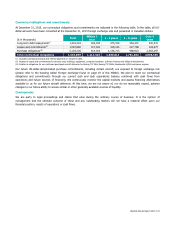
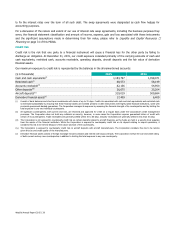
We monitor capital on a number of measures, including the following ratios:
December 31
2015
December 31
2014
Change
Cash to trailing 12 months revenue (TTM)(i)(ii)
29.4%
34.2%
(4.8 pts)
Adjusted debt-to-equity ratio
(i)
1.27 1.44 (11.8%)
Adjusted net debt to EBITDAR(i)
1.29
1.43
(9.8%)
Adjusted net debt to adjusted EBITDAR
(i)(iii)
1.29 1.36
(iii)
(5.1)
(i) Please refer to page 56 of this MD&A for a reconciliation of non-GAAP and additional GAAP measures.
(ii) In addition to our cash and cash equivalents, as of December 31, 2015, we have available our entire $300.0 million revolving credit facility that expires in
June 2018 (please refer to the section
Financing
found on page 31 of this MD&A).
(iii) Adjusted for pre-tax non-cash loss recorded in the third quarter of 2014 associated with the sale of 10 aircraft to Southwest.
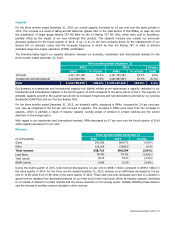
As of December 31, 2015, our cash to TTM revenue ratio was 29.4 per cent, compared to 34.2 per cent at December 31,
2014, representing a decrease of 4.8 percentage points due to a decrease in our cash and cash equivalents balance. At
December 31, 2015 our adjusted debt-to-equity ratio of 1.27 improved from 1.44 at December 31, 2014. Our adjusted net
debt to EBITDAR and our adjusted net debt to adjusted EBITDAR ratios of 1.29, have both improved from 1.43 and 1.36,
respectively, at December 31, 2014. These improvements are in line with our expectations and are a result of our strong
earnings.
Our current ratio, defined as current assets over current liabilities, was 0.97 at December 31, 2015 as compared to 1.29 at
December 31, 2014, a decrease of 24.8 per cent due primarily to increases in accounts payable and accrued liabilities, our
liabilities related to our WestJet Rewards Program, and the current portion of our aircraft maintenance provision as well as a
decrease in our cash and cash equivalents and the absence of an assets held for sale balance that was present in the prior
year.
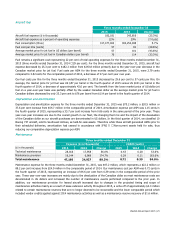
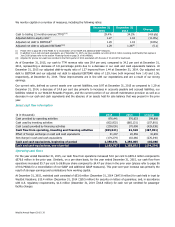
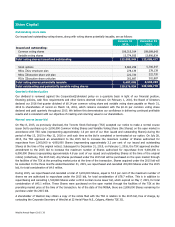
Select cash flow information
($ in thousands) 2015 2014 Change
Cash provided by operating activities
876,441
576,633
299,808
Cash used by investing activities (822,932) (665,131) (157,801)
Cash (used) provided by financing activities
(259,030)
170,008
(429,038)
Cash flow from operating, investing and financing activities
(205,521)
81,510
(287,031)
Effect of foreign exchange on cash and cash equivalents 31,247 20,556 10,691
Net change in cash and cash equivalents (174,274) 102,066 (276,340)
Cash and cash equivalents, beginning of period 1,358,071 1,256,005 102,066
Cash and cash equivalents, end of period
1,183,797
1,358,071
(174,274)
Operating cash flows
For the year ended December 31, 2015, our cash flow from operations increased 52.0 per cent to $876.4 million compared to
$576.6 million in the prior year. Similarly, on a per share basis, for the year ended December 31, 2015, our cash flow from
operations increased 55.7 per cent to $6.96 per share compared to $4.47 per share in the prior year (please refer to page 56
of this MD&A for a reconciliation of non-GAAP and additional GAAP measures). This year-over-year increase was primarily the
result of stronger earnings and contributions from working capital.
At December 31, 2015, restricted cash consisted of $53.6 million (December 31, 2014 – $47.8 million) for cash held in trust by
WestJet Vacations; $13.4 million (December 31, 2014 – $9.5 million) for security on letters of guarantee; and, in accordance
with U.S. regulatory requirements, $1.6 million (December 31, 2014 – $0.8 million) for cash not yet remitted for passenger
facility charges.