Westjet 2015 Annual Report Download - page 89
Download and view the complete annual report
Please find page 89 of the 2015 Westjet annual report below. You can navigate through the pages in the report by either clicking on the pages listed below, or by using the keyword search tool below to find specific information within the annual report.-
 1
1 -
2
-
3
-
4
-
5
-
6
-
7
-
8
-
9
-
10
-
11
-
12
-
13
-
14
-
15
-
16
-
17
-
18
-
19
-
20
-
21
-
22
-
23
-
24
-
25
-
26
-
27
-
28
-
29
-
30
-
31
-
32
-
33
-
34
-
35
-
36
-
37
-
38
-
39
-
40
-
41
-
42
-
43
-
44
-
45
-
46
-
47
-
48
-
49
-
50
-
51
-
52
-
53
-
54
-
55
-
56
-
57
-
58
-
59
-
60
-
61
-
62
-
63
-
64
-
65
-
66
-
67
-
68
-
69
-
70
-
71
-
72
-
73
-
74
-
75
-
76
-
77
-
78
-
 79
79 -
 80
80 -
 81
81 -
 82
82 -
 83
83 -
 84
84 -
 85
85 -
 86
86 -
 87
87 -
 88
88 -
 89
89 -
 90
90 -
 91
91 -
 92
92 -
 93
93 -
 94
94 -
 95
95 -
 96
96 -
 97
97 -
 98
98 -
 99
99 -
100
-
101
 |
 |

Notes to Consolidated Financial Statements
As at and for the years ended December 31, 2015 and 2014
(Stated in thousands of Canadian dollars, except percentage, ratio, share and per share amounts)
WestJet Annual Report 2015 | 87
11. Share capital (continued)
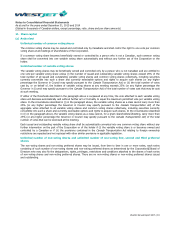
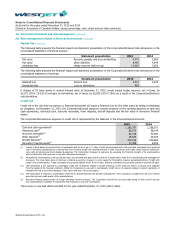
(g) Deferred share units
The Corporation has a cash-settled deferred share unit (DSU) plan as an alternative form of compensation for independent
members of the Corporation’s Board of Directors. Each DSU entitles a participant to receive cash equal to the market value of
the equivalent number of shares of the Corporation. The number of DSUs granted is determined based on the closing price of
the Corporation’s common shares on the trading day immediately prior to the date of grant. Total compensation expense is
recognized at the time of grant. Fluctuations in the market value are recognized to compensation expense in the period in which
the fluctuations occur. For the year ended December 31, 2015, 27,110 (2014 – 18,913) DSUs were granted, with $844 (2014 –
$1,782) of recaptured expense included in salaries and benefits. During the year ended December 31, 2015, the Corporation
settled 12,533 DSUs (2014 - nil). The carrying amount of the liability, included in accounts payable and accrued liabilities,
relating to the cash-settled DSUs at December 31, 2015 is $3,275 (2014 – $4,874). At December 31, 2015, 160,872 (2014 –
146,096) DSUs are vested and outstanding. DSUs are redeemable upon the Director’s retirement from the Board.
(h) Employee share purchase plan
The Corporation has an employee share purchase plan (ESPP), whereby the Corporation matches the contributions made by
employees. Under the terms of the ESPP, employees may, dependent on their employment agreement, contribute up to a
maximum of between 10% and 20% of their gross salary to acquire voting shares of the Corporation at the current fair market
value. The contributions are matched by the Corporation and are required to be held within the ESPP for a period of one year.
Employees may offer to sell ESPP shares, which have not been held for at least one year, to the Corporation, at a purchase price
equal to 50% of the weighted average trading price of the Corporation’s voting shares for the five trading days immediately
preceding the employee’s notice to the Corporation, to a maximum of four times per year.
Under the terms of the ESPP, the Corporation acquires voting shares on behalf of employees through open market purchases.
The Corporation’s share of the contributions in 2015 amounted to $86,776 (2014 – $79,942) and is recorded as compensation
expense within salaries and benefits.
12. Dividends
During the year ended December 31, 2015, the Corporation’s Board of Directors declared quarterly cash dividends of $0.14 per
common voting share and variable voting share. For the year ended December 31, 2015, the Corporation paid dividends totaling
$69,711 (2014 – $61,313).
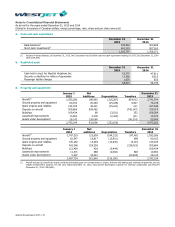
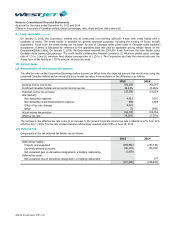
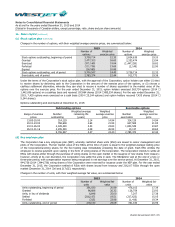
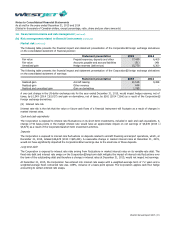
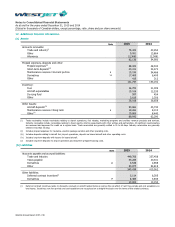
13. Earnings per share
The following reflects the share data used in the computation of basic and diluted earnings per share:
2015
2014
Weighted average number of shares outstanding – basic
125,101,235
127,858,259
Employee stock options
469,217
680,507
Key employee-RSUs
212,080
320,162
Executive-RSUs
87,982
118,449
Executive-PSUs
94,027
165,563
Weighted average number of shares outstanding – diluted
125,964,541
129,142,940
For the year ended December 31, 2015, 2,489,570 employee stock options (2014 – 36,499 options) were not included in the
calculation of dilutive potential shares as the result would have been anti-dilutive.