Westjet 2015 Annual Report Download - page 11
Download and view the complete annual report
Please find page 11 of the 2015 Westjet annual report below. You can navigate through the pages in the report by either clicking on the pages listed below, or by using the keyword search tool below to find specific information within the annual report.-
 1
1 -
 2
2 -
 3
3 -
 4
4 -
 5
5 -
 6
6 -
 7
7 -
 8
8 -
 9
9 -
 10
10 -
 11
11 -
 12
12 -
 13
13 -
 14
14 -
 15
15 -
 16
16 -
 17
17 -
 18
18 -
 19
19 -
 20
20 -
 21
21 -
 22
22 -
23
-
24
-
25
-
26
-
27
-
28
-
29
-
30
-
31
-
32
-
33
-
34
-
35
-
36
-
37
-
38
-
39
-
40
-
41
-
42
-
43
-
44
-
45
-
46
-
47
-
48
-
49
-
50
-
51
-
52
-
53
-
54
-
55
-
56
-
57
-
58
-
59
-
60
-
61
-
62
-
63
-
64
-
65
-
66
-
67
-
68
-
69
-
70
-
71
-
72
-
73
-
74
-
75
-
76
-
77
-
78
-
79
-
80
-
81
-
82
-
83
-
84
-
85
-
86
-
87
-
88
-
89
-
90
-
91
-
92
-
93
-
94
-
95
-
96
-
97
-
98
-
99
-
100
-
101
 |
 |

WestJet Annual Report 2015 | 9
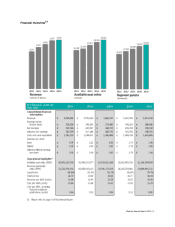
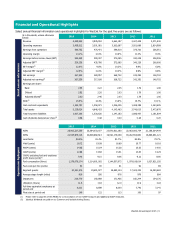
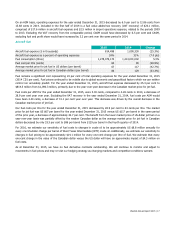
Financial and Operational Highlights
Select annual financial information and operational highlights for WestJet for the past five years are as follows:
($ in thousands, unless otherwise
noted)
2015 2014 2013 2012 2011
Select annual information
Revenue 4,029,265 3,976,552 3,662,197
3,427,409 3,071,540
Operating expenses 3,459,512 3,501,081 3,262,687
3,051,689 2,814,989
Earnings from operations 569,752 475,471 399,510
375,720 256,551
Operating margin 14.1% 12.0% 10.9% 11.0% 8.4%
Earnings before income taxes (EBT) 520,258 390,307 372,085
340,229
208,006
Adjusted EBT(i) 520,258 435,766 372,085
340,229 208,006
EBT margin(i) 12.9% 9.8% 10.2% 9.9% 6.8%
Adjusted EBT margin(i) 12.9% 11.0% 10.2% 9.9% 6.8%
Net earnings 367,530 283,957 268,722
242,392 148,702
Adjusted net earnings(i) 367,530 317,188 268,722
242,392 148,702
Earnings per share:
Basic 2.94 2.22 2.05 1.79 1.06
Diluted 2.92 2.20 2.03 1.78 1.06
Adjusted diluted(i) 2.92 2.46 2.03 1.78 1.06
ROIC(i) 15.3% 14.3% 13.9% 13.7% 10.1%
Cash and cash equivalents 1,183,797 1,358,071 1,256,005
1,408,199 1,243,605
Total assets 5,129,024 4,646,433 4,143,463
3,746,615 3,473,678
Total long-term liabilities 1,617,106 1,530,630 1,147,163
1,086,457 1,161,604
Cash dividends declared per share(ii) 0.56 0.48 0.40 0.28 0.20
2015 2014 2013 2012 2011
Operational highlights
ASMs 26,902,227,359 25,584,033,077 23,970,921,260
22,063,583,754 21,186,304,409
RPMs 21,525,979,116 20,828,992,613 19,591,173,039
18,262,554,881 16,890,941,121
Load factor 80.0% 81.4% 81.7% 82.8% 79.7%
Yield (cents) 18.72 19.09 18.69 18.77 18.18
RASM (cents) 14.98 15.54 15.28 15.53 14.50
CASM (cents) 12.86 13.68 13.61 13.83 13.29
CASM, excluding fuel and employee
profit share (cents)
(i) 9.46 9.15 9.06 9.12 8.85
Fuel consumption (litres) 1,278,079,174 1,214,001,002 1,144,937,872
1,079,108,614 1,027,821,192
Fuel costs per litre (cents) 64 90 91 92 89
Segment guests 20,281,376 19,651,977 18,485,144
17,423,352 16,040,682
Average stage length (miles) 910 936 976 978 984
Departures 209,770 192,858 171,436 160,244 154,176
Utilization (hours) 11.6 11.8 12.0 11.9 11.8
Full-time equivalent employees at
period end
9,211 8,698 8,000 7,742 7,141
Fleet size at period end 140 122 113 100 97
(i) Please refer to page 56 of this MD&A for a reconciliation of non-GAAP measures and additional GAAP measures.
(ii) Identical dividends are paid on our Common and Variable Voting Shares.