Westjet 2015 Annual Report Download - page 91
Download and view the complete annual report
Please find page 91 of the 2015 Westjet annual report below. You can navigate through the pages in the report by either clicking on the pages listed below, or by using the keyword search tool below to find specific information within the annual report.-
 1
1 -
2
-
3
-
4
-
5
-
6
-
7
-
8
-
9
-
10
-
11
-
12
-
13
-
14
-
15
-
16
-
17
-
18
-
19
-
20
-
21
-
22
-
23
-
24
-
25
-
26
-
27
-
28
-
29
-
30
-
31
-
32
-
33
-
34
-
35
-
36
-
37
-
38
-
39
-
40
-
41
-
42
-
43
-
44
-
45
-
46
-
47
-
48
-
49
-
50
-
51
-
52
-
53
-
54
-
55
-
56
-
57
-
58
-
59
-
60
-
61
-
62
-
63
-
64
-
65
-
66
-
67
-
68
-
69
-
70
-
71
-
72
-
73
-
74
-
75
-
76
-
77
-
78
-
79
-
80
-
 81
81 -
 82
82 -
 83
83 -
 84
84 -
 85
85 -
 86
86 -
 87
87 -
 88
88 -
 89
89 -
 90
90 -
 91
91 -
 92
92 -
 93
93 -
 94
94 -
 95
95 -
 96
96 -
 97
97 -
 98
98 -
 99
99 -
 100
100 -
 101
101
 |
 |

Notes to Consolidated Financial Statements
As at and for the years ended December 31, 2015 and 2014
(Stated in thousands of Canadian dollars, except percentage, ratio, share and per share amounts)
WestJet Annual Report 2015 | 89
14. Financial instruments and risk management (continued)
(a) Fair value of financial assets and financial liabilities (continued)
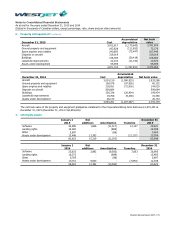
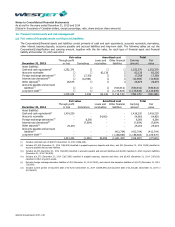
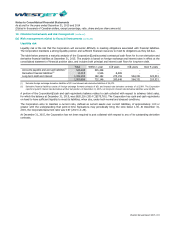
The following items shown in the consolidated statement of financial position at December 31, 2015 and 2014, are measured at
fair value on a recurring basis using level 1 or level 2 inputs. There are no financial assets or liabilities classified as level 3 in the
fair value hierarchy.
December 31, 2015
Level 1
Level 2
Total
Asset (liability):
Cash and cash equivalents
1,252,370
−
1,252,370
Foreign exchange derivatives
−
17,358
17,358
Interest rate derivatives
−
(12,964)
(12,964)
Other deposits
26,675
−
26,675
1,279,045
4,394
1,283,439
December 31, 2014
Level 1
Level 2
Total
Asset (liability):
Cash and cash equivalents
1,416,220
−
1,416,220
Foreign exchange derivatives
−
6,360
6,360
Interest rate derivatives
−
(7,654)
(7,654)
Other deposits
25,204
−
25,204
1,441,424
(1,294)
1,440,130
During the years ended December 31, 2015 and 2014, there were no transfers between level 1, level 2 and level 3 financial
assets and liabilities measured at fair value.
Cash and cash equivalents: Consist of bank balances and short-term investments, primarily highly liquid instruments, with
terms up to 31 days. Classified in level 1 as the measurement inputs are derived from observable, unadjusted quoted prices in
active markets. Interest income is recorded in the consolidated statement of earnings as finance income. Due to its short-term
nature, the carrying value of cash and cash equivalents approximates its fair value.
Foreign exchange derivatives: Consist of foreign exchange forward contracts where the fair value of the forward contracts is
measured based on the difference between the contracted rate and the current forward price. Classified in level 2 as the
significant measurement inputs used in the valuation models are observable in active markets.
At December 31, 2015, the weighted average contracted rate on the forward contracts was 1.3069 (December 31, 2014 –
1.1187) Canadian dollars to one US dollar, and the weighted average forward rate used in determining the fair value was 1.3830
(December 31, 2014 – 1.1640) Canadian dollars to one US dollar.
Interest rate derivatives: Consist of interest rate swap contracts that exchange a floating rate of interest with a fixed rate of
interest. The fair value of the interest rate swaps is determined by measuring the difference between the fixed contracted rate
and the forward curve for the applicable floating interest rates. Classified in level 2 as the significant measurement inputs used
in the valuation models are observable in active markets. At December 31, 2015, the Corporation’s swap contracts have a
weighted average fixed interest rate of 1.69% (December 31, 2014 – 2.60%). The December 31, 2015, weighted average
floating forward interest rate was 1.14% (December 31, 2014 – 1.96%).
Other deposits: Consist of security deposits related to aircraft financing and airport operations deposits that earn a floating
market rate of interest. Classified in level 1 as the measurement inputs are unadjusted, observable inputs in active markets.
Accounts receivable and accounts payable and accrued liabilities: The Corporation designates accounts receivable and
accounts payable and accrued liabilities as loans and receivables and other financial liabilities, respectively. These items are
initially recorded at fair value and subsequently measured at amortized cost. Due to their short-term nature, the carrying value
of accounts receivable and accounts payable and accrued liabilities approximate their fair value.
Long-term debt: The fair value of the Corporation’s long-term debt is determined by discounting the future contractual cash
flows of principal and interest under the current financing arrangements using the Corporation’s December 31, 2015 implied
Corporate BBB- rate of 3.95% (December 31, 2014 – 4.61%) for a 6.44 year term (December 31, 2014 – 6.48 year term), equal
to the weighted average remaining term of the Corporation’s long-term debt at December 31, 2015. The fair value
measurements are classified in level 1 as the measurement inputs are unadjusted, observable inputs in active markets.