Westjet 2015 Annual Report Download - page 21
Download and view the complete annual report
Please find page 21 of the 2015 Westjet annual report below. You can navigate through the pages in the report by either clicking on the pages listed below, or by using the keyword search tool below to find specific information within the annual report.-
 1
1 -
2
-
3
-
4
-
5
-
6
-
7
-
8
-
9
-
10
-
 11
11 -
 12
12 -
 13
13 -
 14
14 -
 15
15 -
 16
16 -
 17
17 -
 18
18 -
 19
19 -
 20
20 -
 21
21 -
 22
22 -
 23
23 -
 24
24 -
 25
25 -
 26
26 -
 27
27 -
 28
28 -
 29
29 -
 30
30 -
 31
31 -
32
-
33
-
34
-
35
-
36
-
37
-
38
-
39
-
40
-
41
-
42
-
43
-
44
-
45
-
46
-
47
-
48
-
49
-
50
-
51
-
52
-
53
-
54
-
55
-
56
-
57
-
58
-
59
-
60
-
61
-
62
-
63
-
64
-
65
-
66
-
67
-
68
-
69
-
70
-
71
-
72
-
73
-
74
-
75
-
76
-
77
-
78
-
79
-
80
-
81
-
82
-
83
-
84
-
85
-
86
-
87
-
88
-
89
-
90
-
91
-
92
-
93
-
94
-
95
-
96
-
97
-
98
-
99
-
100
-
101
 |
 |
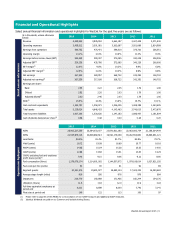
WestJet Annual Report 2015 | 19
Depreciation and amortization
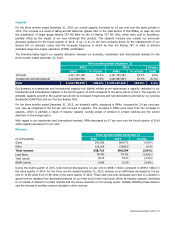
Depreciation and amortization expense for the year ended December 31, 2015 was $264.9 million, a $38.2 million or 16.8 per
cent increase from $226.7 million in 2014. Amortization expense per ASM was 0.98 cents in 2015, representing a 10.1 per
cent increase from 0.89 cents in the prior year. This year-over-year increase is driven by the overall growth in our fleet, the
changing fleet mix and the impact of the devaluation of the Canadian dollar as our aircraft purchases are denominated in US
dollars. Also, an adjustment recorded in the third quarter of 2015 associated with Q400 engine overhauls increased the
expense in 2015 by approximately $2.7 million. In the third quarter of 2014, we classified 10 Boeing 737 aircraft, sold to
Southwest Airlines, as held-for-sale assets. Therefore while these aircraft generated ASMs prior to their scheduled deliveries,
amortization had ceased in accordance with IFRS 5 – Non-current assets held for sale, thus reducing our comparative
depreciation expense per ASM.
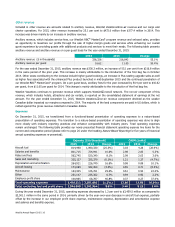
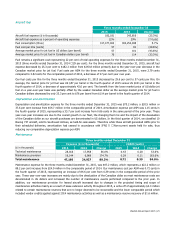
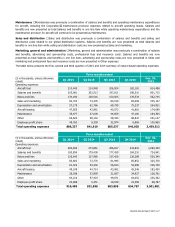
Maintenance
Maintenance expense is comprised of technical maintenance which represents costs incurred for maintenance on our aircraft
fleet and a maintenance provision which represents our estimate of future obligations to meet the lease return conditions
specified in our lease agreements.
Expense ($ in thousands) CASM (cents)
2015
2014
Change
2015
2014
Change
Technical maintenance
101,738 88,328 15.2% 0.38 0.35 8.6%
Maintenance provision
62,567
38,433
62.8%
0.23
0.15
53.3%
Total maintenance
164,305 126,761 29.6%
0.61
0.50
22.0%
Maintenance expense for the year ended December 31, 2015 was $164.3 million, which represents a $37.5 million or 29.6 per
cent increase from $126.8 million in 2014. Our maintenance cost per ASM was 0.61 cents in 2015, representing an increase of
22.0 per cent from 0.50 cents in the prior year.
Technical maintenance expense for the year ended December 31, 2015 was $101.7 million, which represents a $13.4 million
or 15.2 per cent increase from $88.3 million in 2014. Our technical maintenance cost per ASM was 0.38 cents in 2015,
representing an increase of 8.6 per cent from 0.35 cents in the prior year. These year-over-year increases were mainly
attributable to the impact of foreign exchange as most of our maintenance costs are denominated in US dollars. As our fleet
grows we also have increased the number of maintenance events performed compared to the prior year.
Maintenance provision expense for the year ended December 31, 2015 was $62.6 million, which represents a $24.2 million or
62.8 per cent increase from $38.4 million in 2014. The increase was primarily driven by changes in the projected timing and
scope of maintenance activities mainly as a result of lease extension activity throughout 2015 as well as the devaluation of the
Canadian dollar. Our provision is calculated based on the best information available to us and includes estimates of the cost
and timing of future maintenance activities on leased aircraft, as well as discount rates.
Employee profit share
All employees are eligible to participate in the employee profit sharing plan. As the profit share system is a variable cost,
employees receive larger awards when we are more profitable. Conversely, the amount distributed to employees is reduced in
less profitable periods. Our profit share expense for the twelve months ended December 31, 2015, was $101.0 million,
representing a 46.8 per cent increase from $68.8 million in the prior year. This year-over-year increase is directly attributable
to both higher earnings eligible for profit share and to expanded margins eligible for profit share.
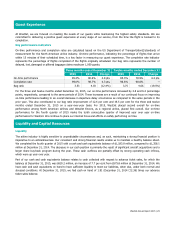
Foreign exchange
The gain or loss on foreign exchange included in our consolidated statement of earnings is mainly attributable to the effect of
the changes in the value of our US-dollar-denominated net monetary assets and liabilities. Monetary assets consist mainly of
US-dollar cash and cash equivalents, security deposits on various leased aircraft, and maintenance reserves paid to lessors,
offset by monetary liabilities of US-dollar accounts payable and accrued liabilities and maintenance provisions. As part of our
Foreign Currency Risk Management Policy we hold US-dollar-denominated cash and short-term investments and enter into US-
dollar foreign exchange forward contracts to protect our balance sheet, operating margins and cash flows. At December 31,
2015, US-dollar-denominated net monetary liabilities totaled approximately US $24.0 million compared to net monetary assets
of US $6.1 million at December 31, 2014. The decrease in US-dollar-denominated net monetary assets compared to 2014 year