Westjet 2015 Annual Report Download - page 18
Download and view the complete annual report
Please find page 18 of the 2015 Westjet annual report below. You can navigate through the pages in the report by either clicking on the pages listed below, or by using the keyword search tool below to find specific information within the annual report.-
 1
1 -
2
-
3
-
4
-
5
-
6
-
7
-
 8
8 -
 9
9 -
 10
10 -
 11
11 -
 12
12 -
 13
13 -
 14
14 -
 15
15 -
 16
16 -
 17
17 -
 18
18 -
 19
19 -
 20
20 -
 21
21 -
 22
22 -
 23
23 -
 24
24 -
 25
25 -
 26
26 -
 27
27 -
 28
28 -
29
-
30
-
31
-
32
-
33
-
34
-
35
-
36
-
37
-
38
-
39
-
40
-
41
-
42
-
43
-
44
-
45
-
46
-
47
-
48
-
49
-
50
-
51
-
52
-
53
-
54
-
55
-
56
-
57
-
58
-
59
-
60
-
61
-
62
-
63
-
64
-
65
-
66
-
67
-
68
-
69
-
70
-
71
-
72
-
73
-
74
-
75
-
76
-
77
-
78
-
79
-
80
-
81
-
82
-
83
-
84
-
85
-
86
-
87
-
88
-
89
-
90
-
91
-
92
-
93
-
94
-
95
-
96
-
97
-
98
-
99
-
100
-
101
 |
 |
WestJet Annual Report 2015 | 16
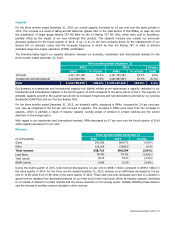
Other revenue
Included in other revenue are amounts related to ancillary revenue, WestJet Vacations’ non-air revenue and our cargo and
charter operations. For 2015, other revenue increased by 25.1 per cent to $472.0 million from $377.4 million in 2014. This
increase was driven mainly by an increase in ancillary revenue.
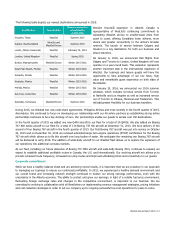
Ancillary revenue, which includes service fees, our WestJet RBC® MasterCard± program revenue and onboard sales, provides
an opportunity to maximize our profits through the sale of higher-margin goods and services while enhancing our overall
guest experience by providing guests with additional products and services to meet their needs. The following table presents
ancillary revenue and ancillary revenue on a per guest basis for the year ended December 31, 2015:
2015 2014 Change
Ancillary revenue ($ in thousands)
336,326 216,842 55.1%
Ancillary revenue per guest
16.62
11.05
50.4%
For the year ended December 31, 2015, ancillary revenue was $336.3 million, an increase of 55.1 per cent from $216.8 million
in the same period of the prior year. This increase is mainly attributable to the introduction of the first bag fee in October
2014. Other areas contributing to the increase include higher guest bookings, an increase in Plus seating upgrade sales as well
as higher fees associated with the enhanced Plus product launched in mid-September 2015 and the continued penetration of
our WestJet RBC® MasterCard± program. On a per guest basis, ancillary fees for the year increased by 50.4 per cent to $16.62
per guest, from $11.05 per guest for 2014. This change is mainly attributable to the introduction of the first bag fee.
WestJet Vacations continues to generate revenue which supports WestJet’s overall network. The non-air component of this
revenue, which includes hotels, attractions and car rentals, is reported on the consolidated statement of earnings at the net
amount. For the year ended December 31, 2015, WestJet Vacations’ non-air revenue component declined as the weaker
Canadian dollar impacted our margins compared to 2014. The majority of the land components are paid in US dollars, which is
netted against the gross revenue collected in Canadian dollars.
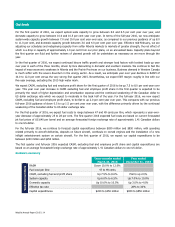
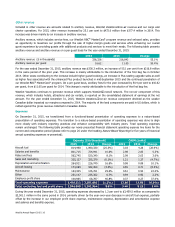
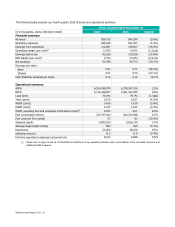
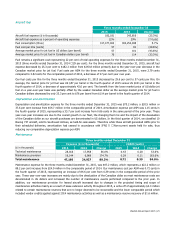
Expenses
On December 31, 2015, we transitioned from a functional-based presentation of operating expenses to a nature-based
presentation of operating expenses. The transition to a nature-based presentation of operating expenses was done to align
more closely with industry reporting practices and enhance comparability with industry peers. Total operating expenses
remain unchanged. The following table provides our newly presented financial statement operating expense line items for the
current and comparative period (please refer to page 26 under the heading
Nature-Based Reporting
for five years of historical
annual operating expenses re-presented).
Expense ($ in thousands) CASM (cents)
2015
2014
Change
2015
2014
Change
Aircraft fuel
814,498
1,090,330
(25.3%) 3.03
4.26
(28.9%)
Salaries and benefits
801,715
724,941
10.6% 2.98
2.83
5.3%
Rates and fees
562,745
520,340
8.1% 2.09
2.03
3.0%
Sales and marketing
325,127 325,370 (0.1%) 1.21 1.27 (4.7%)
Depreciation and amortization
264,921
226,740
16.8% 0.98
0.89
10.1%
Aircraft leasing
174,089
182,450
(4.6%) 0.65
0.71
(8.5%)
Maintenance
164,305
126,761
29.6% 0.61
0.50
22.0%
Other
251,147
235,362
6.7% 0.94
0.92
2.2%
Employee profit share
100,965
68,787
46.8%
0.37
0.27
37.0%
Total operating expenses 3,459,512
3,501,081
(1.2%) 12.86
13.68
(6.0%)
Total, excluding fuel and profit share
2,544,049
2,341,964
8.6%
9.46
9.15
3.4%
During the year ended December 31, 2015, operating expenses decreased by 1.2 per cent to $3,459.5 million as compared to
$3,501.1 million in the same period in 2014, primarily driven by the year-over-year decrease in aircraft fuel expense, partially
offset by the increase in our employee profit share expense, maintenance expense, depreciation and amortization expense
and salaries and benefits expense.