Westjet 2015 Annual Report Download - page 23
Download and view the complete annual report
Please find page 23 of the 2015 Westjet annual report below. You can navigate through the pages in the report by either clicking on the pages listed below, or by using the keyword search tool below to find specific information within the annual report.-
 1
1 -
2
-
3
-
4
-
5
-
6
-
7
-
8
-
9
-
10
-
11
-
12
-
 13
13 -
 14
14 -
 15
15 -
 16
16 -
 17
17 -
 18
18 -
 19
19 -
 20
20 -
 21
21 -
 22
22 -
 23
23 -
 24
24 -
 25
25 -
 26
26 -
 27
27 -
 28
28 -
 29
29 -
 30
30 -
 31
31 -
 32
32 -
 33
33 -
34
-
35
-
36
-
37
-
38
-
39
-
40
-
41
-
42
-
43
-
44
-
45
-
46
-
47
-
48
-
49
-
50
-
51
-
52
-
53
-
54
-
55
-
56
-
57
-
58
-
59
-
60
-
61
-
62
-
63
-
64
-
65
-
66
-
67
-
68
-
69
-
70
-
71
-
72
-
73
-
74
-
75
-
76
-
77
-
78
-
79
-
80
-
81
-
82
-
83
-
84
-
85
-
86
-
87
-
88
-
89
-
90
-
91
-
92
-
93
-
94
-
95
-
96
-
97
-
98
-
99
-
100
-
101
 |
 |

WestJet Annual Report 2015 | 21
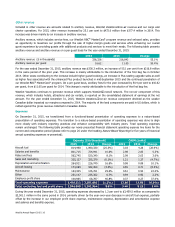
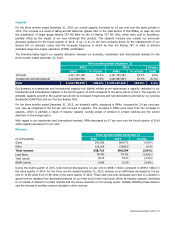
Income taxes
Our effective consolidated income tax rate for both the three and twelve months ended December 31, 2015 was 32 per cent
and 29 per cent respectively, as compared to 27 per cent for the same periods in 2014. The year-over-year increase in our
effective rate for both the three and twelve months ended December 31, 2015, was due to a 20 per cent increase to the
general corporate income tax rate in Alberta to 12 per cent, from 10 per cent, effective July 1, 2015, which resulted in an
increase to deferred income taxes of $2.6 million in 2015.
For 2016, we anticipate that our annual effective tax rate will fall within in the range of 28 to 30 per cent.
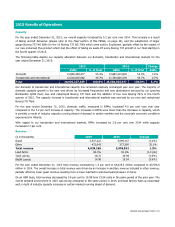
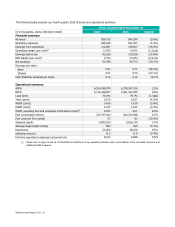
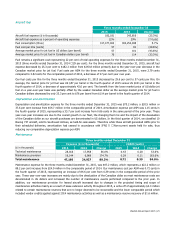
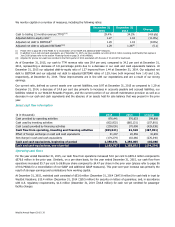
2015 Fourth Quarter Results of Operations
Our 2015 fourth quarter financial results represent our 43rd consecutive quarter of reported profitability with net earnings of
$63.4 million and diluted earnings per share of $0.51 representing year-over-year declines of 30.1 per cent and 27.1 per cent,
respectively. During the quarter, our revenue decreased by 3.6 per cent as compared to the fourth quarter of 2014 while
RASM decreased 5.8 per cent year over year.
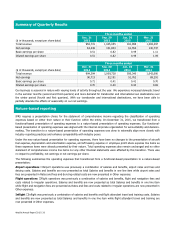
Fourth quarter overview
• Recognized total revenue of $958.7 million, a decrease of 3.6 per cent from $994.4 million in the fourth quarter of
2014.
• Increased capacity, measured in ASMs, by 2.3 per cent over the fourth quarter of 2014.
• Increased traffic, measured in RPMs, by 0.6 per cent over the fourth quarter of 2014.
• Realized yield of 18.75 cents, down 4.2 per cent from 19.57 in the fourth quarter of 2014.
• Realized RASM of 14.69 cents, down 5.8 per cent from 15.59 cents in the fourth quarter of 2014.
• Realized CASM of 12.97 cents, down 3.2 per cent from 13.40 cents in the fourth quarter of 2014.
• Realized CASM, excluding fuel and employee profit share, of 10.04 cents, up 9.0 per cent from 9.21 cents in the
fourth quarter of 2014.
• Recorded an operating margin of 11.8 per cent, down 2.2 percentage points from 14.0 per cent in the fourth quarter
of 2014.
• Recorded an EBT margin of 9.7 per cent, down 2.9 percentage points from 12.6 per cent in the fourth quarter of
2014.
• Realized net earnings of $63.4 million, a decrease of 30.1 per cent from $90.7 million in the fourth quarter of 2014.
• Reported diluted earnings per share of $0.51, down 27.1 per cent from $0.70 in the fourth quarter of 2014.