Westjet 2015 Annual Report Download - page 59
Download and view the complete annual report
Please find page 59 of the 2015 Westjet annual report below. You can navigate through the pages in the report by either clicking on the pages listed below, or by using the keyword search tool below to find specific information within the annual report.-
 1
1 -
2
-
3
-
4
-
5
-
6
-
7
-
8
-
9
-
10
-
11
-
12
-
13
-
14
-
15
-
16
-
17
-
18
-
19
-
20
-
21
-
22
-
23
-
24
-
25
-
26
-
27
-
28
-
29
-
30
-
31
-
32
-
33
-
34
-
35
-
36
-
37
-
38
-
39
-
40
-
41
-
42
-
43
-
44
-
45
-
46
-
47
-
48
-
 49
49 -
 50
50 -
 51
51 -
 52
52 -
 53
53 -
 54
54 -
 55
55 -
 56
56 -
 57
57 -
 58
58 -
 59
59 -
 60
60 -
 61
61 -
 62
62 -
 63
63 -
 64
64 -
 65
65 -
 66
66 -
 67
67 -
 68
68 -
 69
69 -
70
-
71
-
72
-
73
-
74
-
75
-
76
-
77
-
78
-
79
-
80
-
81
-
82
-
83
-
84
-
85
-
86
-
87
-
88
-
89
-
90
-
91
-
92
-
93
-
94
-
95
-
96
-
97
-
98
-
99
-
100
-
101
 |
 |
WestJet Annual Report 2015 | 57
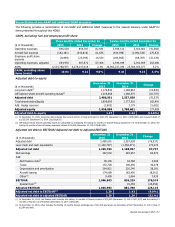
Reconciliation of non-GAAP and additional GAAP measures
The following provides a reconciliation of non-GAAP and additional GAAP measures to the nearest measure under GAAP for
items presented throughout this MD&A.
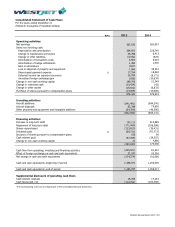
CASM, excluding fuel and employee profit share
Three months ended December 31
Twelve months ended December 31
($ in thousands)
2015 2014 Change 2015 2014 Change
Operating expenses
846,028
854,787
(8,759)
3,459,512
3,501,081
(41,568)
Aircraft fuel expense (182,181) (243,816) 61,635 (814,498) (1,090,330) 275,832
Employee profit share
expense
(8,869) (23,399) 14,530 (100,965) (68,787) (32,178)
Operating expenses, adjusted 654,978 587,572 67,406 2,544,049 2,341,964 202,086
ASMs 6,524,788,975 6,378,247,018 2.3% 26,902,227,359 25,584,033,077 5.2%
CASM, excluding above
items (cents)
10.04 9.21 9.0% 9.46 9.15 3.4%
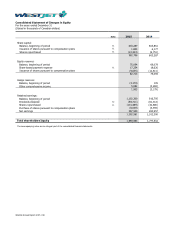
Adjusted debt-to-equity
($ in thousands)
December 31
2015
December 31
2014
Change
Long-term debt
(i)
1,174,833 1,188,663 (13,830)
Off-balance-sheet aircraft operating leases
(ii)
1,305,668 1,368,375 (62,707)
Adjusted debt 2,480,501 2,557,038 (76,537)
Total shareholders’ equity 1,959,993 1,777,502 182,491
Add: Hedge reserves (1,903) 3,179 (5,082)
Adjusted equity
1,958,090
1,780,681
177,409
Adjusted debt-to-equity 1.27 1.44 (11.8%)
(i) At December 31, 2015, long-term debt includes the current portion of long-term debt of $141,572 (December 31, 2014 – $159,843) and long-term debt of
$1,033,261 (December 31, 2014 – $1,028,820).
(ii) Off-balance-sheet aircraft operating leases are calculated by multiplying the trailing 12 months of aircraft leasing expense by 7.5. At December 31, 2015, the
trailing 12 months of aircraft leasing expenses totaled $174,089 (December 31, 2014 – $182,450).
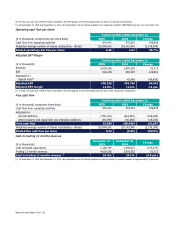
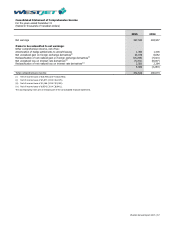
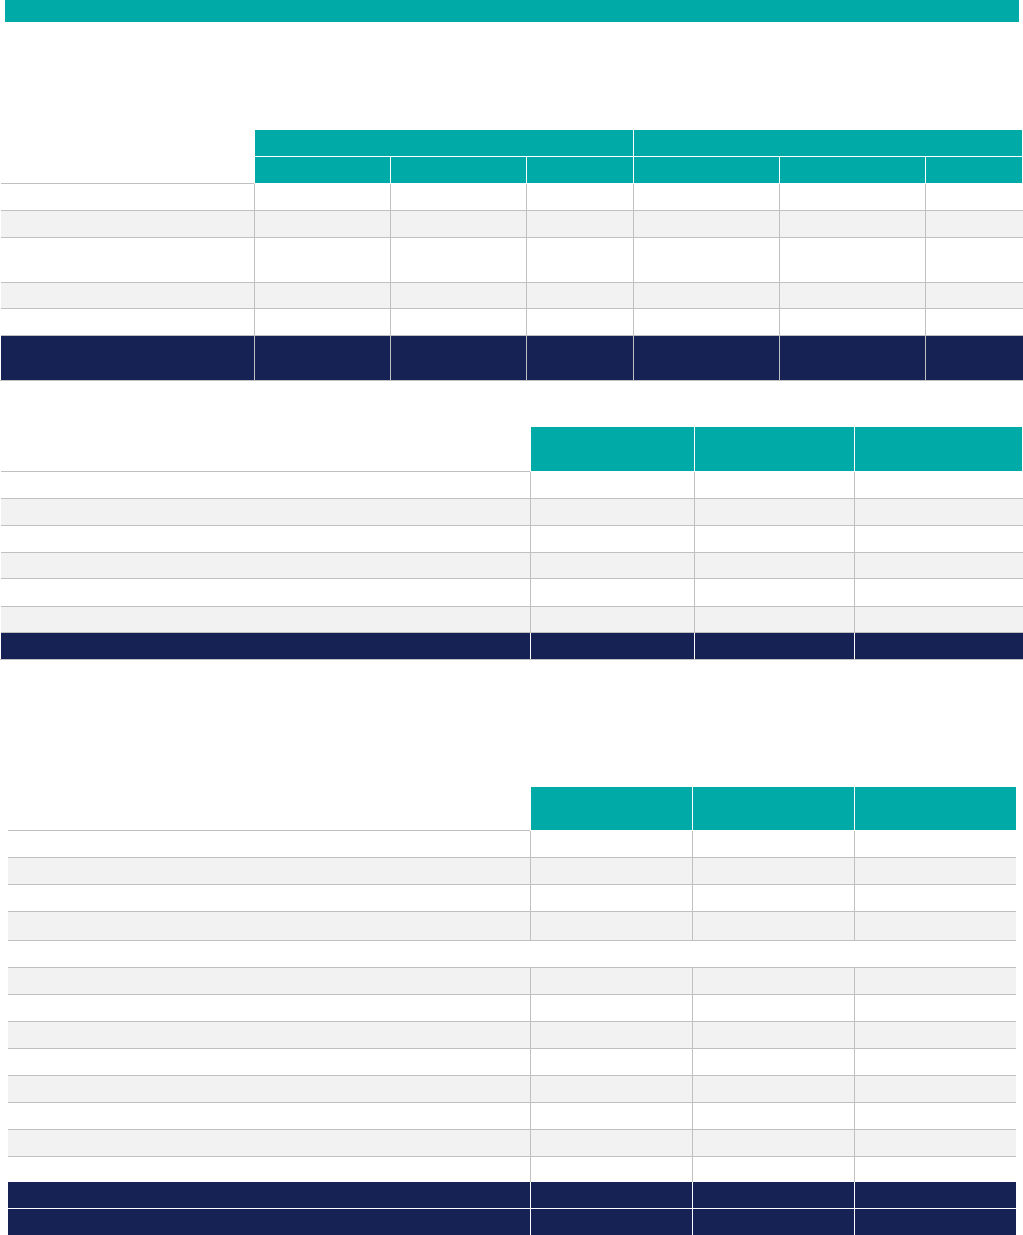
Adjusted net debt to EBITDAR/Adjusted net debt to adjusted EBITDAR
($ in thousands)
December 31
2015
December 31
2014
Change
Adjusted debt 2,480,501 2,557,038 (76,537)
Less: Cash and cash equivalents
(1,183,797)
(1,358,071)
174,274
Adjusted net debt
1,296,704
1,198,967
97,737
Net earnings 367,530 283,957 83,573
Add:
Net finance costs(i)
38,136
34,768
3,368
Taxes 152,728 106,350 46,378
Depreciation and amortization
264,921
226,740
38,181
Aircraft leasing 174,089 182,450 (8,361)
Other
(ii)
9,499 2,064 7,435
EBITDAR
1,006,903
836,329
170,574
Special Item
(iii)
- 45,459 (45,459)
Adjusted EBITDAR
1,006,903
881,788
125,115
Adjusted net debt to EBITDAR(iv)
1.29
1.43
(9.8%)
Adjusted net debt to adjusted EBITDAR
1.29 1.36 (5.1%)
(i) At December 31, 2015, net finance costs includes the trailing 12 months of finance income of $15,529 (December 31, 2014 – $17,070) and the trailing 12
months of finance cost of $53,665 (December 31, 2014 – $51,838).
(ii) At December 31, 2015, other includes the trailing 12 months foreign exchange loss of $10,326 and a gain on derivatives of 827 (December 31, 2014 – loss of
$2,064 and $nil).