Westjet 2015 Annual Report Download - page 60
Download and view the complete annual report
Please find page 60 of the 2015 Westjet annual report below. You can navigate through the pages in the report by either clicking on the pages listed below, or by using the keyword search tool below to find specific information within the annual report.-
 1
1 -
2
-
3
-
4
-
5
-
6
-
7
-
8
-
9
-
10
-
11
-
12
-
13
-
14
-
15
-
16
-
17
-
18
-
19
-
20
-
21
-
22
-
23
-
24
-
25
-
26
-
27
-
28
-
29
-
30
-
31
-
32
-
33
-
34
-
35
-
36
-
37
-
38
-
39
-
40
-
41
-
42
-
43
-
44
-
45
-
46
-
47
-
48
-
49
-
 50
50 -
 51
51 -
 52
52 -
 53
53 -
 54
54 -
 55
55 -
 56
56 -
 57
57 -
 58
58 -
 59
59 -
 60
60 -
 61
61 -
 62
62 -
 63
63 -
 64
64 -
 65
65 -
 66
66 -
 67
67 -
 68
68 -
 69
69 -
 70
70 -
71
-
72
-
73
-
74
-
75
-
76
-
77
-
78
-
79
-
80
-
81
-
82
-
83
-
84
-
85
-
86
-
87
-
88
-
89
-
90
-
91
-
92
-
93
-
94
-
95
-
96
-
97
-
98
-
99
-
100
-
101
 |
 |
WestJet Annual Report 2015 | 58
(iii) Pre-tax non-cash loss of $45.5 million recorded in the third quarter of 2014 associated with the sale of 10 aircraft to Southwest.
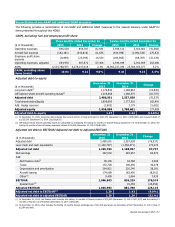
(iv) At December 31, 2015 and December 31, 2014, the Corporation met its internal guideline of an adjusted net debt to EBITDAR measure of no more than 2.50.
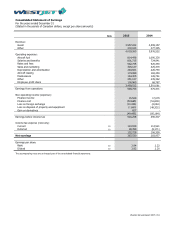
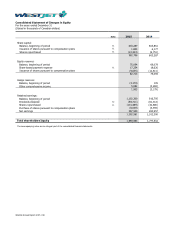
Operating cash flow per share
Twelve months ended December 31
($ in thousands, except share per share data) 2015 2014 Change
Cash flow from operating activities
876,441
576,633
299,808
Weighted average number of shares outstanding - diluted 125,964,541 129,142,940 (3,178,399)
Diluted operating cash flow per share
6.96
4.47
55.7%
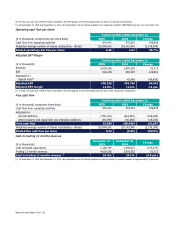
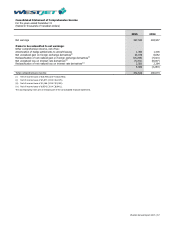
Adjusted EBT Margin
Twelve months ended December 31
($ in thousands)
2015
2014
Change
Revenue
4,029,265 3,976,552 52,713
EBT
520,258
390,307
129,951
Adjusted for:
Special item(i)
― 45,459 (45,459)
Adjusted EBT 520,258 435,766 84,492
Adjusted EBT margin
12.9%
11.0%
1.9 pts.
(i) Pre-tax non-cash loss of $45.5 million recorded in the third quarter of 2014 associated with the sale of the 10 aircraft to Southwest.
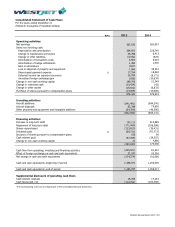
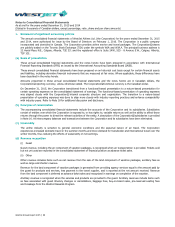
Free cash flow
Twelve months ended December 31
($ in thousands, except per share data)
2015
2014 Change
Cash flow from operating activities
876,441
576,633
299,808
Adjusted for:
Aircraft additions
(758,143)
(618,545)
(139,598)
Other property and equipment and intangible additions (64,789) (46,586) (18,203)
Free cash flow
53,509
(88,498)
142,007
Weighted average number of shares outstanding - diluted 125,964,541 129,142,940 (3,178,399)
Diluted free cash flow per share
0.42
(0.69)
160.9%
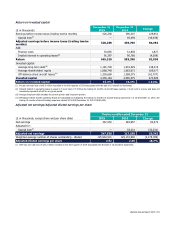
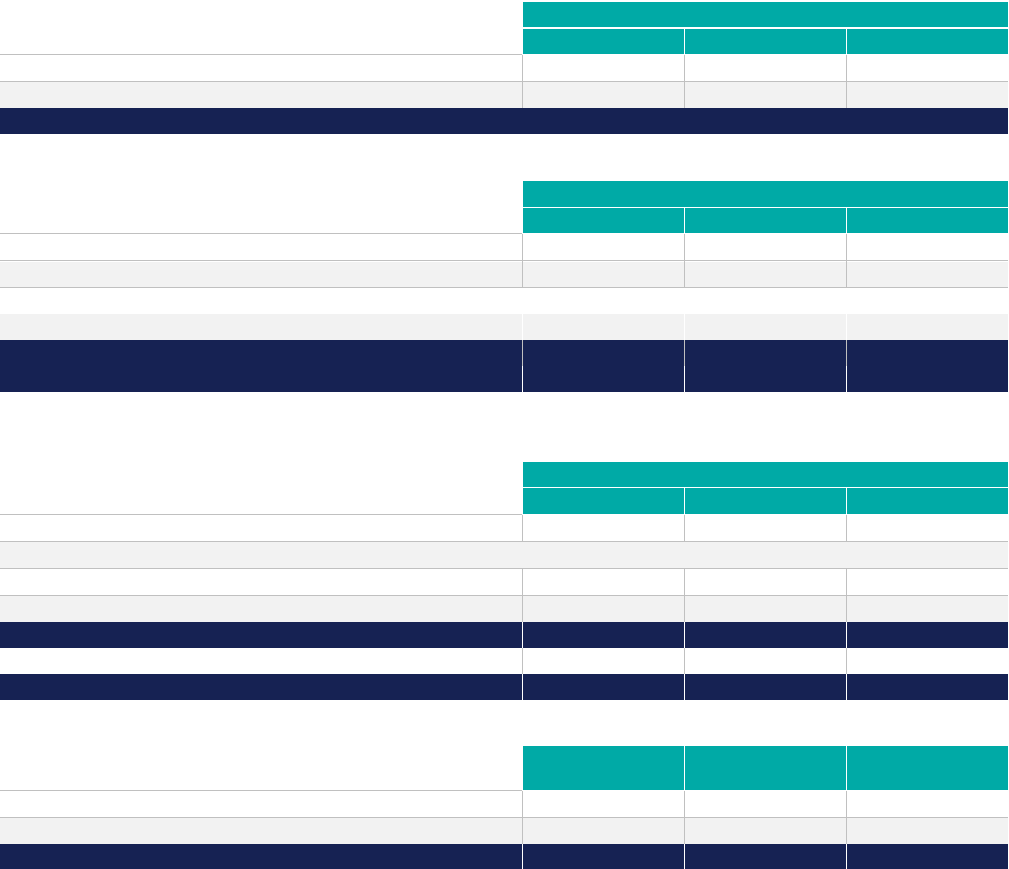
Cash to trailing 12 months revenue
($ in thousands)
December 31
2015
December 31
2014
Change
Cash and cash equivalents 1,183,797 1,358,071 (174,274)
Trailing 12 months revenue 4,029,265 3,976,552 52,713
Cash to trailing 12 months revenue (i)
29.4%
34.2%
(4.8 pts.)
(i) At December 31, 2015 and December 31, 2014, the Corporation met its internal guideline of cash to trailing 12 months revenue of approximately 30 per cent.