United Healthcare 2006 Annual Report Download - page 92
Download and view the complete annual report
Please find page 92 of the 2006 United Healthcare annual report below. You can navigate through the pages in the report by either clicking on the pages listed below, or by using the keyword search tool below to find specific information within the annual report.-
 1
1 -
2
-
3
-
4
-
5
-
6
-
7
-
8
-
9
-
10
-
11
-
12
-
13
-
14
-
15
-
16
-
17
-
18
-
19
-
20
-
21
-
22
-
23
-
24
-
25
-
26
-
27
-
28
-
29
-
30
-
31
-
32
-
33
-
34
-
35
-
36
-
37
-
38
-
39
-
40
-
41
-
42
-
43
-
44
-
45
-
46
-
47
-
48
-
49
-
50
-
51
-
52
-
53
-
54
-
55
-
56
-
57
-
58
-
59
-
60
-
61
-
62
-
63
-
64
-
65
-
66
-
67
-
68
-
69
-
70
-
71
-
72
-
73
-
74
-
75
-
76
-
77
-
78
-
79
-
80
-
81
-
 82
82 -
 83
83 -
 84
84 -
 85
85 -
 86
86 -
 87
87 -
 88
88 -
 89
89 -
 90
90 -
 91
91 -
 92
92 -
 93
93 -
 94
94 -
 95
95 -
 96
96 -
 97
97 -
 98
98 -
 99
99 -
 100
100 -
 101
101 -
 102
102 -
103
-
104
-
105
-
106
-
107
-
108
-
109
-
110
-
111
-
112
-
113
-
114
-
115
-
116
-
117
-
118
-
119
-
120
-
121
-
122
-
123
-
124
-
125
-
126
-
127
-
128
-
129
-
130
 |
 |

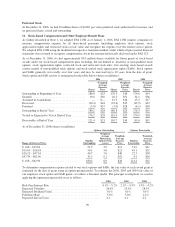
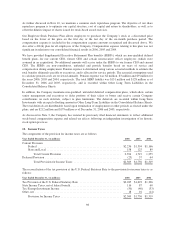
6. Cash, Cash Equivalents and Investments
As of December 31, the amortized cost, gross unrealized gains and losses, and fair value of cash, cash
equivalents and investments were as follows (in millions):
Amortized
Cost
Gross
Unrealized
Gains
Gross
Unrealized
Losses
Fair
Value
2006
Cash and Cash Equivalents ............................... $10,320 $ — $ — $10,320
Debt Securities — Available for Sale ....................... 9,710 57 (52) 9,715
Equity Securities — Available for Sale ...................... 291 22 (1) 312
Debt Securities — Held to Maturity ........................ 235 — — 235
Total Cash and Investments ........................... $20,556 $ 79 $(53) $20,582
2005
Cash and Cash Equivalents ............................... $ 5,421 $ — $ — $ 5,421
Debt Securities — Available for Sale ....................... 9,011 60 (52) 9,019
Equity Securities — Available for Sale ...................... 217 45 (1) 261
Debt Securities — Held to Maturity ........................ 281 — — 281
Total Cash and Investments ........................... $14,930 $105 $(53) $14,982
As of December 31, 2006 and 2005, respectively, debt securities consisted of $3,310 million and $2,256 million
in U.S. Government and Agency obligations, $4,203 million and $4,554 million in state and municipal
obligations, and $2,437 million and $2,490 million in corporate obligations. At December 31, 2006, we held
$833 million in debt securities with maturities of less than one year, $3,694 million in debt securities with
maturities of one to five years, $2,733 million in debt securities with maturities of five to 10 years and $2,690
million in debt securities with maturities of more than ten years.
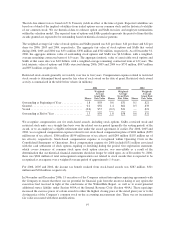
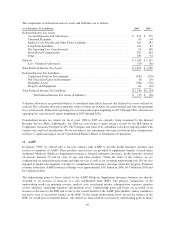
In accordance with FASB Staff Position FAS 115-1/124-1, “The Meaning of Other-Than-Temporary Impairment
and Its Application to Certain Investments,” the following table shows the gross unrealized losses and fair value
of investments with unrealized losses that, in our judgment, are other-than-temporarily impaired. These
investments are aggregated by investment type and length of time that individual securities have been in a
continuous unrealized loss position (in millions)1:
As of December 31, 2006
Less Than 12 Months
12 Months or
Greater Total
Fair
Value
Gross
Unrealized
Losses
Fair
Value
Gross
Unrealized
Losses
Fair
Value
Gross
Unrealized
Losses
U.S. Government and Agency obligations ....... $1,433 $ (7) $ 643 $(11) $2,076 $(18)
State and municipal obligations ................ 956 (4) 1,171 (12) 2,127 (16)
Corporate obligations ........................ 635 (4) 855 (14) 1,490 (18)
Total Debt Securities — Available for Sale . . $3,024 $(15) $2,669 $(37) $5,693 $(52)
Total Equity Securities ................... $ 19 (1) $ — — $ 19 $ (1)
(1) Debt securities classified as held-to-maturity investments have been excluded from this analysis. These
investments are predominantly held in U.S. Government or Agency obligations and the contractual terms do
not permit the issuer to settle the securities at a price less than the amortized cost of the investment.
Additionally, the fair values of these investments approximate their amortized cost.
The unrealized losses on investments in U.S. Government and Agency obligations, state and municipal
obligations and corporate obligations at December 31, 2006 were mainly caused by interest rate increases and not
90