United Healthcare 2006 Annual Report Download - page 33
Download and view the complete annual report
Please find page 33 of the 2006 United Healthcare annual report below. You can navigate through the pages in the report by either clicking on the pages listed below, or by using the keyword search tool below to find specific information within the annual report.-
 1
1 -
2
-
3
-
4
-
5
-
6
-
7
-
8
-
9
-
10
-
11
-
12
-
13
-
14
-
15
-
16
-
17
-
18
-
19
-
20
-
21
-
22
-
 23
23 -
 24
24 -
 25
25 -
 26
26 -
 27
27 -
 28
28 -
 29
29 -
 30
30 -
 31
31 -
 32
32 -
 33
33 -
 34
34 -
 35
35 -
 36
36 -
 37
37 -
 38
38 -
 39
39 -
 40
40 -
 41
41 -
 42
42 -
 43
43 -
44
-
45
-
46
-
47
-
48
-
49
-
50
-
51
-
52
-
53
-
54
-
55
-
56
-
57
-
58
-
59
-
60
-
61
-
62
-
63
-
64
-
65
-
66
-
67
-
68
-
69
-
70
-
71
-
72
-
73
-
74
-
75
-
76
-
77
-
78
-
79
-
80
-
81
-
82
-
83
-
84
-
85
-
86
-
87
-
88
-
89
-
90
-
91
-
92
-
93
-
94
-
95
-
96
-
97
-
98
-
99
-
100
-
101
-
102
-
103
-
104
-
105
-
106
-
107
-
108
-
109
-
110
-
111
-
112
-
113
-
114
-
115
-
116
-
117
-
118
-
119
-
120
-
121
-
122
-
123
-
124
-
125
-
126
-
127
-
128
-
129
-
130
 |
 |

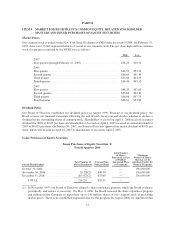
The following tables illustrate the effect of the restatement adjustments on our pro forma net earnings and pro
forma net earnings per share if we had recorded compensation expense based on the estimated grant date fair
value accounting method as defined by FAS 123 for all stock-based awards granted from 1995 to 2003. Refer to
Note 3 for an illustration of the effect of the FAS 123R restatement adjustments relating to 2004 and 2005.
(in millions, except per share data)-Unaudited 2003 2002 2001 2000 1999 1998 1997 1996 1995
Net Earnings
APB 25
As Reported — APB 25 ........... $1,825 $1,352 $ 913 $ 736 $ 568 $ (214) $ 431 $ 327 $ 279
Restatement Adjustments — APB 25:
Compensation Expense, net of
tax effects ................ (123) (100) (172) (177) (27) (40) (16) (20) (17)
Other Adjustments, net of tax
effects ................... (7) (1) (5) (3) (3) (2) (3) (2) (3)
As Restated — APB 25 .... $1,695 $1,251 $ 736 $ 556 $ 538 $ (256) $ 412 $ 305 $ 259
FAS 123 Pro Forma
As Restated-APB 25 .............. $1,695 $1,251 $ 736 $ 556 $ 538 $ (256) $ 412 $ 305 $ 259
Less: APB 25 Compensation Expense,
net of tax effects ............... 123 100 172 177 27 40 16 20 17
FAS 123 Historical Compensation
Expense, net of tax effects ........ (122) (101) (82) (76) (37) (40) (30) (24) (20)
Restatement Adjustments
FAS 123 Compensation
Expense, net of tax effects .... (41) (44) (53) (94) (14) (22) (8) (4) (4)
As Restated — FAS 123 Pro Forma . . $1,655 $1,206 $ 773 $ 563 $ 514 $ (278) $ 390 $ 297 $ 252
Basic Net Earnings Per Common Share:
As Reported — APB 25 ........... $ 1.55 $ 1.11 $0.73 $0.57 $0.41 $(0.14) $0.29 $0.23 $0.20
As Restated — APB 25 ............ $ 1.44 $ 1.03 $0.59 $0.43 $0.39 $(0.17) $0.28 $0.21 $0.19
As Restated — FAS 123 Pro Forma . . $ 1.40 $ 0.99 $0.62 $0.43 $0.37 $(0.18) $0.26 $0.20 $0.18
Diluted Net Earnings Per Common Share:
As Reported — APB 25 ........... $ 1.48 $ 1.06 $0.70 $0.55 $0.40 $(0.14) $0.28 $0.22 $0.20
As Restated — APB 25 ............ $ 1.37 $ 0.99 $0.56 $0.41 $0.38 $(0.17) $0.27 $0.20 $0.18
As Restated — FAS 123 Pro Forma . . $ 1.34 $ 0.95 $0.59 $0.42 $0.36 $(0.18) $0.25 $0.20 $0.18
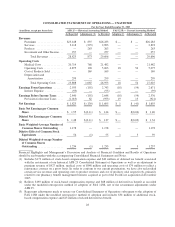
2006 Financial Performance Highlights
UnitedHealth Group had very strong results in 2006. The Company achieved diversified growth across its
business segments and generated net earnings of $4.2 billion, representing an increase of 35% over 2005. Other
financial performance highlights include:
• Diluted net earnings per common share of $2.97, an increase of 29% over 2005.
• Consolidated revenues of $71.5 billion, an increase of 54% over 2005, with revenues advancing in each
business segment. Excluding the impact of acquisitions, revenues increased 21% over 2005.
• Earnings from operations of $7.0 billion, up $1.9 billion, or 37%, over 2005.
• Operating margin of 9.8%, down from 10.9% in 2005, primarily due to changes in business mix related to the
PacifiCare acquisition and the launch of the Medicare Part D program.
• Cash flows from operations of $6.5 billion, up from $4.1 billion in 2005.
31