United Healthcare 2006 Annual Report Download - page 108
Download and view the complete annual report
Please find page 108 of the 2006 United Healthcare annual report below. You can navigate through the pages in the report by either clicking on the pages listed below, or by using the keyword search tool below to find specific information within the annual report.-
 1
1 -
2
-
3
-
4
-
5
-
6
-
7
-
8
-
9
-
10
-
11
-
12
-
13
-
14
-
15
-
16
-
17
-
18
-
19
-
20
-
21
-
22
-
23
-
24
-
25
-
26
-
27
-
28
-
29
-
30
-
31
-
32
-
33
-
34
-
35
-
36
-
37
-
38
-
39
-
40
-
41
-
42
-
43
-
44
-
45
-
46
-
47
-
48
-
49
-
50
-
51
-
52
-
53
-
54
-
55
-
56
-
57
-
58
-
59
-
60
-
61
-
62
-
63
-
64
-
65
-
66
-
67
-
68
-
69
-
70
-
71
-
72
-
73
-
74
-
75
-
76
-
77
-
78
-
79
-
80
-
81
-
82
-
83
-
84
-
85
-
86
-
87
-
88
-
89
-
90
-
91
-
92
-
93
-
94
-
95
-
96
-
97
-
 98
98 -
 99
99 -
 100
100 -
 101
101 -
 102
102 -
 103
103 -
 104
104 -
 105
105 -
 106
106 -
 107
107 -
 108
108 -
 109
109 -
 110
110 -
 111
111 -
 112
112 -
 113
113 -
 114
114 -
 115
115 -
 116
116 -
 117
117 -
 118
118 -
119
-
120
-
121
-
122
-
123
-
124
-
125
-
126
-
127
-
128
-
129
-
130
 |
 |

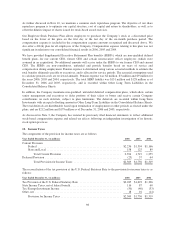
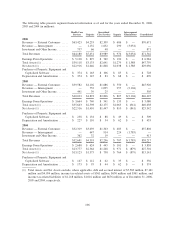
The following table presents segment financial information as of and for the years ended December 31, 2006,
2005 and 2004 (in millions):
Health Care
Services Uniprise
Specialized
Care Services Ingenix
Intersegment
Eliminations Consolidated
2006
Revenues — External Customers ..... $63,423 $4,253 $2,309 $ 686 $ — $70,671
Revenues — Intersegment .......... — 1,132 1,632 290 (3,054) —
Investment and Other Income ........ 757 66 48 — — 871
Total Revenues ................... $64,180 $5,451 $3,989 $ 976 $(3,054) $71,542
Earnings From Operations .......... $ 5,128 $ 897 $ 769 $ 190 $ — $ 6,984
Total Assets (1) ................... $39,118 $3,133 $2,641 $1,279 $ 1,588 $47,759
Net Assets (1) .................... $22,916 $1,646 $1,848 $1,038 $ 1,588 $29,036
Purchases of Property, Equipment and
Capitalized Software ............. $ 374 $ 163 $ 106 $ 85 $ — $ 728
Depreciation and Amortization ....... $ 374 $ 145 $ 83 $ 68 $ — $ 670
2005
Revenues — External Customers ..... $39,582 $4,102 $1,686 $ 550 $ — $45,920
Revenues — Intersegment .......... — 752 1,095 257 (2,104) —
Investment and Other Income ........ 441 39 25 — — 505
Total Revenues ................... $40,023 $4,893 $2,806 $ 807 $(2,104) $46,425
Earnings From Operations .......... $ 3,664 $ 740 $ 541 $ 135 $ — $ 5,080
Total Assets (1) ................... $35,643 $2,598 $2,175 $1,063 $ (841) $40,638
Net Assets (1) .................... $22,516 $1,410 $1,447 $ 810 $ (841) $25,342
Purchases of Property, Equipment and
Capitalized Software ............. $ 238 $ 134 $ 88 $ 49 $ — $ 509
Depreciation and Amortization ....... $ 227 $ 110 $ 54 $ 62 $ — $ 453
2004
Revenues — External Customers ..... $32,319 $3,639 $1,363 $ 483 $ — $37,804
Revenues — Intersegment .......... — 647 914 224 (1,785) —
Investment and Other Income ........ 362 32 19 — — 413
Total Revenues ................... $32,681 $4,318 $2,296 $ 707 $(1,785) $38,217
Earnings From Operations .......... $ 2,688 $ 624 $ 445 $ 101 $ — $ 3,858
Total Assets (1) ................... $23,777 $2,364 $1,268 $ 971 $ (879) $27,501
Net Assets (1) .................... $13,123 $1,375 $ 758 $ 764 $ (879) $15,141
Purchases of Property, Equipment and
Capitalized Software ............. $ 147 $ 112 $ 62 $ 35 $ — $ 356
Depreciation and Amortization ....... $ 173 $ 95 $ 44 $ 62 $ — $ 374
(1) Total Assets and Net Assets exclude, where applicable, debt and accrued interest of $7,569 million, $7,161
million and $4,054 million, income tax-related assets of $561 million, $650 million and $361 million, and
income tax-related liabilities of $1,218 million, $1,016 million and $676 million as of December 31, 2006,
2005 and 2004, respectively.
106