United Healthcare 2006 Annual Report Download - page 24
Download and view the complete annual report
Please find page 24 of the 2006 United Healthcare annual report below. You can navigate through the pages in the report by either clicking on the pages listed below, or by using the keyword search tool below to find specific information within the annual report.-
 1
1 -
2
-
3
-
4
-
5
-
6
-
7
-
8
-
9
-
10
-
11
-
12
-
13
-
 14
14 -
 15
15 -
 16
16 -
 17
17 -
 18
18 -
 19
19 -
 20
20 -
 21
21 -
 22
22 -
 23
23 -
 24
24 -
 25
25 -
 26
26 -
 27
27 -
 28
28 -
 29
29 -
 30
30 -
 31
31 -
 32
32 -
 33
33 -
 34
34 -
35
-
36
-
37
-
38
-
39
-
40
-
41
-
42
-
43
-
44
-
45
-
46
-
47
-
48
-
49
-
50
-
51
-
52
-
53
-
54
-
55
-
56
-
57
-
58
-
59
-
60
-
61
-
62
-
63
-
64
-
65
-
66
-
67
-
68
-
69
-
70
-
71
-
72
-
73
-
74
-
75
-
76
-
77
-
78
-
79
-
80
-
81
-
82
-
83
-
84
-
85
-
86
-
87
-
88
-
89
-
90
-
91
-
92
-
93
-
94
-
95
-
96
-
97
-
98
-
99
-
100
-
101
-
102
-
103
-
104
-
105
-
106
-
107
-
108
-
109
-
110
-
111
-
112
-
113
-
114
-
115
-
116
-
117
-
118
-
119
-
120
-
121
-
122
-
123
-
124
-
125
-
126
-
127
-
128
-
129
-
130
 |
 |
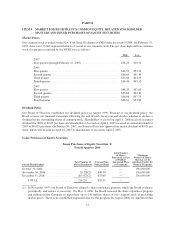
we would not purchase shares under this stock repurchase program until we had completed our restatement
(which is reflected in this Form 10-K) and become current in our periodic SEC filings. As a result, we did
not repurchase any shares through this publicly announced program for the quarter ended December 31,
2006.
(2) Represents shares of common stock withheld by the Company, as permitted by the applicable equity award
certificates, to satisfy tax withholding obligations upon vesting of shares of restricted stock.
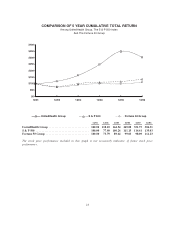
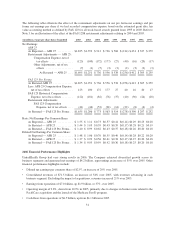
Performance Graphs
The following two performance graphs compare the Company’s total return to shareholders with indexes of other
specified companies and the S&P 500 Index. The first graph compares the cumulative five-year total return to
shareholders on UnitedHealth Group’s common stock relative to the cumulative total returns of the S&P 500
index, and a customized peer group (the “Fortune 50 Group”), an index of certain Fortune 50 companies. The
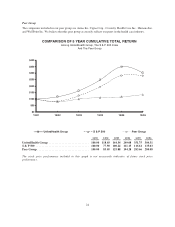
second graph compares our cumulative total return to shareholders with the S&P 500 Index and an index of a
group of peer companies selected by us for the five-year period ended December 31, 2006. The Company is not
included in either the Fortune 50 Group index in the first graph or the peer group index in the second graph. In
calculating the cumulative total shareholder return of the indexes, the shareholder returns of the Fortune 50
Group companies in the first graph and the peer group companies in the second graph are weighted according to
the stock market capitalizations of the companies at January 1 of each year. The comparisons assume the
investment of $100 on December 31, 2001 in company common stock and in each index, and that dividends were
reinvested when paid.
Fortune 50 Group
The Fortune 50 Group consists of the following companies: American International Group Inc, Berkshire
Hathaway Inc, Cardinal Health Inc, Citigroup Inc, General Electric Company, International Business Machine
Corp. and Johnson & Johnson. Although there are differences in terms of size and industry, like UnitedHealth
Group, all of these companies are large multi-segment companies using a well-defined operating model in one or
more broad sectors of the economy. These companies have also distinguished themselves by the consistency of
their growth and performance, in many cases over multiple decades.
22