United Healthcare 2006 Annual Report Download - page 52
Download and view the complete annual report
Please find page 52 of the 2006 United Healthcare annual report below. You can navigate through the pages in the report by either clicking on the pages listed below, or by using the keyword search tool below to find specific information within the annual report.-
 1
1 -
2
-
3
-
4
-
5
-
6
-
7
-
8
-
9
-
10
-
11
-
12
-
13
-
14
-
15
-
16
-
17
-
18
-
19
-
20
-
21
-
22
-
23
-
24
-
25
-
26
-
27
-
28
-
29
-
30
-
31
-
32
-
33
-
34
-
35
-
36
-
37
-
38
-
39
-
40
-
41
-
 42
42 -
 43
43 -
 44
44 -
 45
45 -
 46
46 -
 47
47 -
 48
48 -
 49
49 -
 50
50 -
 51
51 -
 52
52 -
 53
53 -
 54
54 -
 55
55 -
 56
56 -
 57
57 -
 58
58 -
 59
59 -
 60
60 -
 61
61 -
 62
62 -
63
-
64
-
65
-
66
-
67
-
68
-
69
-
70
-
71
-
72
-
73
-
74
-
75
-
76
-
77
-
78
-
79
-
80
-
81
-
82
-
83
-
84
-
85
-
86
-
87
-
88
-
89
-
90
-
91
-
92
-
93
-
94
-
95
-
96
-
97
-
98
-
99
-
100
-
101
-
102
-
103
-
104
-
105
-
106
-
107
-
108
-
109
-
110
-
111
-
112
-
113
-
114
-
115
-
116
-
117
-
118
-
119
-
120
-
121
-
122
-
123
-
124
-
125
-
126
-
127
-
128
-
129
-
130
 |
 |

The analyses above include those outcomes that are considered reasonably likely based on the Company’s
historical experience in estimating its liabilities for incurred but not reported benefit claims.
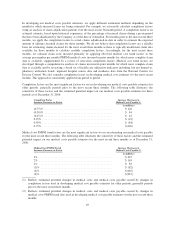
In order to evaluate the impact of changes in medical cost estimates for any particular discrete period, one should
consider both the amount of development recorded in the current period pertaining to prior periods and the
amount of development recorded in subsequent periods pertaining to the current period. The accompanying table
provides a summary of the net impact of favorable development on medical costs and earnings from operations
(in millions).
Favorable
Development
Increase (Decrease)
to Medical Costs(a)
Medical Costs Earnings from Operations
As Restated (b) As Adjusted (c) As Restated (b) As Adjusted
2002 ............ $ 70 $ (80) $18,938 $18,858 $1,969 $2,049
2003 ............ $150 $ (60) $21,482 $21,422 $2,671 $2,731
2004 ............ $210 $(190) $27,858 $27,668 $3,858 $4,048
2005 ............ $400 $ (30) $33,669 $33,639 $5,080 $5,110
2006 ............ $430 (d) $53,308 (d) $6,984 (d)
(a) The amount of favorable development recorded in the current year pertaining to the prior year less the
amount of favorable development recorded in the subsequent year pertaining to the current year.
(b) Restated to include the impact of FAS 123R, which we adopted effective January 1, 2006, as well as
impacts associated with the restatement described in Note 3 “Restatement of Consolidated Financial
Statements.”
(c) Represents reported amounts adjusted to reflect the net impact of medical cost development.
(d) Not yet determinable as the amount of prior period development recorded in 2007 will change as our
December 31, 2006 medical costs payable estimate develops throughout 2007.
Our estimate of medical costs payable represents management’s best estimate of the Company’s liability for
unpaid medical costs as of December 31, 2006, developed using consistently applied actuarial methods.
Management believes the amount of medical costs payable is reasonable and adequate to cover the Company’s
liability for unpaid claims as of December 31, 2006; however, actual claim payments may differ from established
estimates. The increase in favorable medical cost development in 2006 was driven primarily by growth in the
size of the medical cost base and related medical payables due to organic growth and businesses acquired since
the beginning of 2005. As our medical costs payable estimate increases in amount due to increases in the fully
insured consumer base and inflationary increases in medical costs, the absolute dollar amount of subsequent
changes to that estimate will increase even if the accuracy of our medical costs payable estimate remains
consistent as a percentage of the original estimate. Assuming a hypothetical 1% difference between our
December 31, 2006 estimates of medical costs payable and actual medical costs payable, excluding the AARP
business, 2006 earnings from operations would increase or decrease by $71 million and diluted net earnings per
common share would increase or decrease by $0.03 per share.
Historic Stock Option Measurement Dates
The selection by the Company of the methodologies described in Note 3 of the Notes to Consolidated Financial
Statements to determine the measurement dates of historic stock option grants involved judgment and careful
evaluation of all relevant facts and circumstances for each historical grant. The Company believes it has used the
most appropriate methodologies. However, the Company also conducted a sensitivity analysis to assess how the
restatement adjustments would have changed under two alternative methodologies for determining measurement
dates. The following table sets forth the incremental effect on earnings before income taxes that would result
from using the alternate measurement date determination methodologies described below:
•Communication Date. This methodology would select as the measurement date the date on which stock
option grants were communicated to employees, assuming that the communication date is readily
50