United Healthcare 2006 Annual Report Download - page 50
Download and view the complete annual report
Please find page 50 of the 2006 United Healthcare annual report below. You can navigate through the pages in the report by either clicking on the pages listed below, or by using the keyword search tool below to find specific information within the annual report.-
 1
1 -
2
-
3
-
4
-
5
-
6
-
7
-
8
-
9
-
10
-
11
-
12
-
13
-
14
-
15
-
16
-
17
-
18
-
19
-
20
-
21
-
22
-
23
-
24
-
25
-
26
-
27
-
28
-
29
-
30
-
31
-
32
-
33
-
34
-
35
-
36
-
37
-
38
-
39
-
 40
40 -
 41
41 -
 42
42 -
 43
43 -
 44
44 -
 45
45 -
 46
46 -
 47
47 -
 48
48 -
 49
49 -
 50
50 -
 51
51 -
 52
52 -
 53
53 -
 54
54 -
 55
55 -
 56
56 -
 57
57 -
 58
58 -
 59
59 -
 60
60 -
61
-
62
-
63
-
64
-
65
-
66
-
67
-
68
-
69
-
70
-
71
-
72
-
73
-
74
-
75
-
76
-
77
-
78
-
79
-
80
-
81
-
82
-
83
-
84
-
85
-
86
-
87
-
88
-
89
-
90
-
91
-
92
-
93
-
94
-
95
-
96
-
97
-
98
-
99
-
100
-
101
-
102
-
103
-
104
-
105
-
106
-
107
-
108
-
109
-
110
-
111
-
112
-
113
-
114
-
115
-
116
-
117
-
118
-
119
-
120
-
121
-
122
-
123
-
124
-
125
-
126
-
127
-
128
-
129
-
130
 |
 |
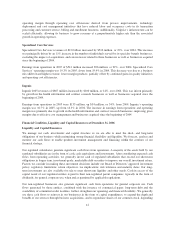
these subsidiaries to maintain specified levels of statutory capital, as defined by each state, and restrict the timing
and amount of dividends and other distributions that may be paid to their parent companies. Generally, the
amount of dividend distributions that may be paid by a regulated subsidiary, without prior approval by state
regulatory authorities, is limited based on the entity’s level of statutory net income and statutory capital and
surplus. We maintain an aggregate statutory capital level for our regulated subsidiaries that is significantly higher
than the minimum level regulators require.
In 2006, based on 2005 statutory net income and statutory capital and surplus levels, the maximum amount of
dividends which could be paid without prior regulatory approval was approximately $2.2 billion. For the year
ended December 31, 2006, the Company’s regulated subsidiaries paid over $2.5 billion in dividends to their
parent companies, including approximately $300 million of special dividends approved by state insurance
regulators.
The inability of the Company’s regulated subsidiaries to pay dividends to their parent companies would impact
the scale to which we could reinvest in our business through capital expenditures, business acquisitions and the
repurchase of shares of our common stock. In addition, the inability to pay regulated dividends could impact our
ability to repay our debt; however, our cash flows from operating activities generated from our non-regulated
businesses greatly mitigate this risk. As of December 31, 2006, approximately $1.9 billion of our $20.6 billion of
cash and investments was held by non-regulated subsidiaries and available for general corporate use.
Critical Accounting Policies and Estimates
Critical accounting policies are those policies that require management to make challenging, subjective or
complex judgments, often because they must estimate the effects of matters that are inherently uncertain and may
change in subsequent periods. Critical accounting policies involve judgments and uncertainties that are
sufficiently sensitive to result in materially different results under different assumptions and conditions. We
believe our critical accounting policies are those described below. For a detailed discussion of these and other
accounting policies, see Note 2 of the Notes to Consolidated Financial Statements.
Medical Costs
Each reporting period, we estimate our obligations for medical care services that have been rendered on behalf of
insured consumers for which we have either not yet received or processed claims, and for liabilities for
physician, hospital and other medical cost disputes. We develop estimates for medical costs incurred but not
reported using an actuarial process that is consistently applied, centrally controlled and automated. The actuarial
models consider factors such as time from date of service to claim receipt, claim backlogs, care provider contract
rate changes, medical care consumption and other medical cost trends. Depending on the health care provider and
type of service, the typical billing lag for services can range from two to 90 days from the date of service.
Substantially all claims related to medical care services are known and settled within nine to twelve months from
the date of service. We estimate liabilities for physician, hospital and other medical cost disputes based upon an
analysis of potential outcomes, assuming a combination of litigation and settlement strategies.
Each period, we re-examine previously established medical costs payable estimates based on actual claim
submissions and other changes in facts and circumstances. As the liability estimates recorded in prior periods
become more exact, we adjust the amount of the estimates, and include the changes in estimates in medical costs
in the period in which the change is identified. In every reporting period, our operating results include the effects
of more completely developed medical costs payable estimates associated with previously reported periods. If the
revised estimate of prior period medical costs is less than the previous estimate, we will decrease reported
medical costs in the current period (favorable development). If the revised estimate of prior period medical costs
is more than the previous estimate, we will increase reported medical costs in the current period (unfavorable
development). Historically, the net impact of estimate developments has represented less than 1% of annual
medical costs, less than 5% of annual earnings from operations and less than 4% of medical costs payable.
48