Under Armour 2011 Annual Report Download - page 82
Download and view the complete annual report
Please find page 82 of the 2011 Under Armour annual report below. You can navigate through the pages in the report by either clicking on the pages listed below, or by using the keyword search tool below to find specific information within the annual report.-
 1
1 -
2
-
3
-
4
-
5
-
6
-
7
-
8
-
9
-
10
-
11
-
12
-
13
-
14
-
15
-
16
-
17
-
18
-
19
-
20
-
21
-
22
-
23
-
24
-
25
-
26
-
27
-
28
-
29
-
30
-
31
-
32
-
33
-
34
-
35
-
36
-
37
-
38
-
39
-
40
-
41
-
42
-
43
-
44
-
45
-
46
-
47
-
48
-
49
-
50
-
51
-
52
-
53
-
54
-
55
-
56
-
57
-
58
-
59
-
60
-
61
-
62
-
63
-
64
-
65
-
66
-
67
-
68
-
69
-
70
-
71
-
 72
72 -
 73
73 -
 74
74 -
 75
75 -
 76
76 -
 77
77 -
 78
78 -
 79
79 -
 80
80 -
 81
81 -
 82
82 -
 83
83 -
 84
84 -
 85
85 -
 86
86 -
 87
87 -
 88
88 -
 89
89 -
 90
90 -
 91
91 -
 92
92 -
93
-
94
-
95
-
96
 |
 |

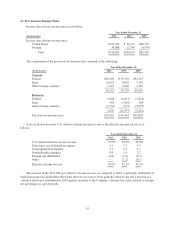
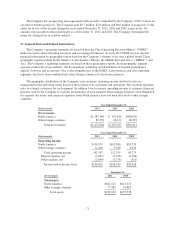
Net revenues by product category are as follows:
(In thousands)
Year Ended December 31,
2011 2010 2009
Apparel $1,122,031 $ 853,493 $651,779
Footwear 181,684 127,175 136,224
Accessories 132,400 43,882 35,077
Total net sales 1,436,115 1,024,550 823,080
License revenues 36,569 39,377 33,331
Total net revenues $1,472,684 $1,063,927 $856,411
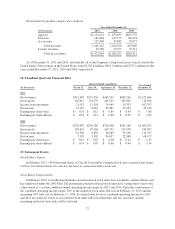
As of December 31, 2011 and 2010, substantially all of the Company’s long-lived assets were located in the
United States. Net revenues in the United States were $1,325.8 million, $952.9 million and $771.2 million for the
years ended December 31, 2011, 2010 and 2009, respectively.
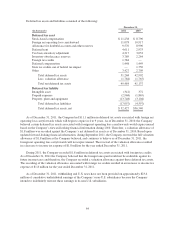
18. Unaudited Quarterly Financial Data
(In thousands)
Quarter Ended (unaudited) Year Ended
December 31,March 31, June 30, September 30, December 31,
2011
Net revenues $312,699 $291,336 $465,523 $403,126 $1,472,684
Gross profit 145,051 134,779 225,101 207,905 712,836
Income from operations 21,142 11,358 74,965 55,302 162,767
Net income 12,139 6,241 45,987 32,552 96,919
Earnings per share-basic $ 0.24 $ 0.12 $ 0.89 $ 0.63 $ 1.88
Earnings per share-diluted $ 0.23 $ 0.12 $ 0.88 $ 0.62 $ 1.85
2010
Net revenues $229,407 $204,786 $328,568 $301,166 $1,063,927
Gross profit 107,631 99,926 167,372 155,578 530,507
Income from operations 13,584 6,892 56,689 35,190 112,355
Net income 7,170 3,502 34,857 22,948 68,477
Earnings per share-basic $ 0.14 $ 0.07 $ 0.68 $ 0.45 $ 1.35
Earnings per share-diluted $ 0.14 $ 0.07 $ 0.68 $ 0.44 $ 1.34
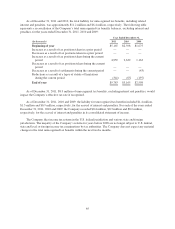
19. Subsequent Events
Stockholders’ Equity
In February 2012, 150.0 thousand shares of Class B Convertible Common Stock were converted into shares
of Class A Common Stock on a one-for-one basis in connection with a stock sale.
Stock-Based Compensation
In February 2012, 0.4 million performance-based restricted stock units were awarded to certain officers and
key employees under the 2005 Plan. The performance-based restricted stock units have vesting that is tied to the
achievement of a certain combined annual operating income target for 2013 and 2014. Upon the achievement of
the combined operating income target, 50% of the restricted stock units will vest on February 15, 2015 and the
remaining 50% will vest on February 15, 2016. If certain lower levels of combined operating income for 2013
and 2014 are achieved, fewer or no restricted stock units will vest at that time and one year later, and the
remaining restricted stock units will be forfeited.
72