Under Armour 2011 Annual Report Download - page 36
Download and view the complete annual report
Please find page 36 of the 2011 Under Armour annual report below. You can navigate through the pages in the report by either clicking on the pages listed below, or by using the keyword search tool below to find specific information within the annual report.-
 1
1 -
2
-
3
-
4
-
5
-
6
-
7
-
8
-
9
-
10
-
11
-
12
-
13
-
14
-
15
-
16
-
17
-
18
-
19
-
20
-
21
-
22
-
23
-
24
-
25
-
 26
26 -
 27
27 -
 28
28 -
 29
29 -
 30
30 -
 31
31 -
 32
32 -
 33
33 -
 34
34 -
 35
35 -
 36
36 -
 37
37 -
 38
38 -
 39
39 -
 40
40 -
 41
41 -
 42
42 -
 43
43 -
 44
44 -
 45
45 -
 46
46 -
47
-
48
-
49
-
50
-
51
-
52
-
53
-
54
-
55
-
56
-
57
-
58
-
59
-
60
-
61
-
62
-
63
-
64
-
65
-
66
-
67
-
68
-
69
-
70
-
71
-
72
-
73
-
74
-
75
-
76
-
77
-
78
-
79
-
80
-
81
-
82
-
83
-
84
-
85
-
86
-
87
-
88
-
89
-
90
-
91
-
92
-
93
-
94
-
95
-
96
 |
 |

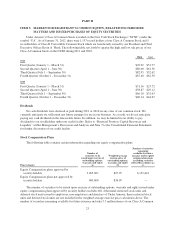
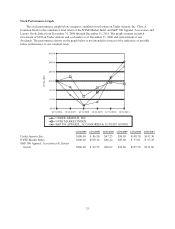
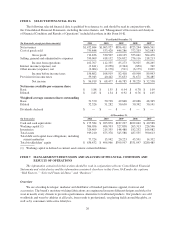
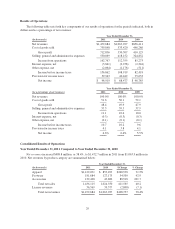
ITEM 6. SELECTED FINANCIAL DATA
The following selected financial data is qualified by reference to, and should be read in conjunction with,
the Consolidated Financial Statements, including the notes thereto, and “Management’s Discussion and Analysis
of Financial Condition and Results of Operations” included elsewhere in this Form 10-K.
Year Ended December 31,
(In thousands, except per share amounts) 2011 2010 2009 2008 2007
Net revenues $1,472,684 $1,063,927 $856,411 $725,244 $606,561
Cost of goods sold 759,848 533,420 446,286 372,203 302,083
Gross profit 712,836 530,507 410,125 353,041 304,478
Selling, general and administrative expenses 550,069 418,152 324,852 276,116 218,213
Income from operations 162,767 112,355 85,273 76,925 86,265
Interest income (expense), net (3,841) (2,258) (2,344) (850) 749
Other income (expense), net (2,064) (1,178) (511) (6,175) 2,029
Income before income taxes 156,862 108,919 82,418 69,900 89,043
Provision for income taxes 59,943 40,442 35,633 31,671 36,485
Net income $ 96,919 $ 68,477 $ 46,785 $ 38,229 $ 52,558
Net income available per common share
Basic $ 1.88 $ 1.35 $ 0.94 $ 0.78 $ 1.09
Diluted $ 1.85 $ 1.34 $ 0.92 $ 0.76 $ 1.05
Weighted average common shares outstanding
Basic 51,570 50,798 49,848 49,086 48,345
Diluted 52,526 51,282 50,650 50,342 50,141
Dividends declared $ — $ — $ — $ — $ —
At December 31,
(In thousands) 2011 2010 2009 2008 2007
Cash and cash equivalents $ 175,384 $ 203,870 $187,297 $102,042 $ 40,588
Working capital (1) 506,056 406,703 327,838 263,313 226,546
Inventories 324,409 215,355 148,488 182,232 166,082
Total assets 919,210 675,378 545,588 487,555 390,613
Total debt and capital lease obligations, including
current maturities 77,724 15,942 20,223 45,591 14,332
Total stockholders’ equity $ 636,432 $ 496,966 $399,997 $331,097 $280,485
(1) Working capital is defined as current assets minus current liabilities.
ITEM 7. MANAGEMENT’S DISCUSSION AND ANALYSIS OF FINANCIAL CONDITION AND
RESULTS OF OPERATIONS
The information contained in this section should be read in conjunction with our Consolidated Financial
Statements and related notes and the information contained elsewhere in this Form 10-K under the captions
“Risk Factors,” “Selected Financial Data,” and “Business.”
Overview
We are a leading developer, marketer and distributor of branded performance apparel, footwear and
accessories. The brand’s moisture-wicking fabrications are engineered in many different designs and styles for
wear in nearly every climate to provide a performance alternative to traditional products. Our products are sold
worldwide and worn by athletes at all levels, from youth to professional, on playing fields around the globe, as
well as by consumers with active lifestyles.
26