Under Armour 2011 Annual Report Download - page 58
Download and view the complete annual report
Please find page 58 of the 2011 Under Armour annual report below. You can navigate through the pages in the report by either clicking on the pages listed below, or by using the keyword search tool below to find specific information within the annual report.-
 1
1 -
2
-
3
-
4
-
5
-
6
-
7
-
8
-
9
-
10
-
11
-
12
-
13
-
14
-
15
-
16
-
17
-
18
-
19
-
20
-
21
-
22
-
23
-
24
-
25
-
26
-
27
-
28
-
29
-
30
-
31
-
32
-
33
-
34
-
35
-
36
-
37
-
38
-
39
-
40
-
41
-
42
-
43
-
44
-
45
-
46
-
47
-
 48
48 -
 49
49 -
 50
50 -
 51
51 -
 52
52 -
 53
53 -
 54
54 -
 55
55 -
 56
56 -
 57
57 -
 58
58 -
 59
59 -
 60
60 -
 61
61 -
 62
62 -
 63
63 -
 64
64 -
 65
65 -
 66
66 -
 67
67 -
 68
68 -
69
-
70
-
71
-
72
-
73
-
74
-
75
-
76
-
77
-
78
-
79
-
80
-
81
-
82
-
83
-
84
-
85
-
86
-
87
-
88
-
89
-
90
-
91
-
92
-
93
-
94
-
95
-
96
 |
 |

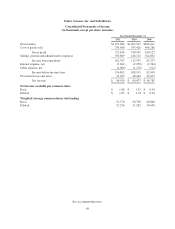
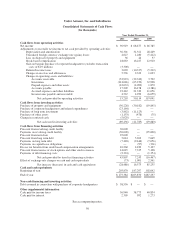
Under Armour, Inc. and Subsidiaries
Consolidated Statements of Income
(In thousands, except per share amounts)
Year Ended December 31,
2011 2010 2009
Net revenues $1,472,684 $1,063,927 $856,411
Cost of goods sold 759,848 533,420 446,286
Gross profit 712,836 530,507 410,125
Selling, general and administrative expenses 550,069 418,152 324,852
Income from operations 162,767 112,355 85,273
Interest expense, net (3,841) (2,258) (2,344)
Other expense, net (2,064) (1,178) (511)
Income before income taxes 156,862 108,919 82,418
Provision for income taxes 59,943 40,442 35,633
Net income $ 96,919 $ 68,477 $ 46,785
Net income available per common share
Basic $ 1.88 $ 1.35 $ 0.94
Diluted $ 1.85 $ 1.34 $ 0.92
Weighted average common shares outstanding
Basic 51,570 50,798 49,848
Diluted 52,526 51,282 50,650
See accompanying notes.
48