Under Armour 2011 Annual Report Download - page 78
Download and view the complete annual report
Please find page 78 of the 2011 Under Armour annual report below. You can navigate through the pages in the report by either clicking on the pages listed below, or by using the keyword search tool below to find specific information within the annual report.-
 1
1 -
2
-
3
-
4
-
5
-
6
-
7
-
8
-
9
-
10
-
11
-
12
-
13
-
14
-
15
-
16
-
17
-
18
-
19
-
20
-
21
-
22
-
23
-
24
-
25
-
26
-
27
-
28
-
29
-
30
-
31
-
32
-
33
-
34
-
35
-
36
-
37
-
38
-
39
-
40
-
41
-
42
-
43
-
44
-
45
-
46
-
47
-
48
-
49
-
50
-
51
-
52
-
53
-
54
-
55
-
56
-
57
-
58
-
59
-
60
-
61
-
62
-
63
-
64
-
65
-
66
-
67
-
 68
68 -
 69
69 -
 70
70 -
 71
71 -
 72
72 -
 73
73 -
 74
74 -
 75
75 -
 76
76 -
 77
77 -
 78
78 -
 79
79 -
 80
80 -
 81
81 -
 82
82 -
 83
83 -
 84
84 -
 85
85 -
 86
86 -
 87
87 -
 88
88 -
89
-
90
-
91
-
92
-
93
-
94
-
95
-
96
 |
 |

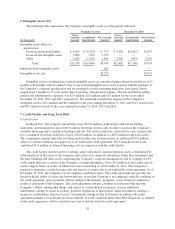
A summary of the Company’s stock options as of December 31, 2011, 2010 and 2009, and changes during
the years then ended is presented below:
(In thousands, except per share amounts)
Year Ended December 31,
2011 2010 2009
Number
of Stock
Options
Weighted
Average
Exercise
Price
Number
of Stock
Options
Weighted
Average
Exercise
Price
Number
of Stock
Options
Weighted
Average
Exercise
Price
Outstanding, beginning of year 2,974 $25.31 2,831 $18.02 2,456 $15.92
Granted, at fair market value 110 72.10 1,435 29.32 1,364 14.53
Exercised (563) 22.83 (799) 7.64 (853) 4.69
Expired (13) 18.95 (7) 41.26 (34) 33.87
Forfeited (104) 26.82 (486) 23.52 (102) 27.04
Outstanding, end of year 2,404 $27.99 2,974 $25.31 2,831 $18.02
Options exercisable, end of year 423 $25.42 304 $33.04 908 $11.58
The intrinsic value of stock options exercised during the years ended December 31, 2011, 2010 and 2009
was $27.4 million, $7.6 million and $14.8 million, respectively.
The following table summarizes information about stock options outstanding and exercisable as of
December 31, 2011:
(In thousands, except per share amounts)
Options Outstanding Options Exercisable
Number of
Underlying
Shares
Weighted
Average
Exercise
Price Per
Share
Weighted
Average
Remaining
Contractual
Life (Years)
Total
Intrinsic
Value
Number of
Underlying
Shares
Weighted
Average
Exercise
Price Per
Share
Weighted
Average
Remaining
Contractual
Life (Years)
Total
Intrinsic
Value
2,404 $27.99 7.6 $105,280 423 $25.42 6.2 $19,615
Included in the tables above are 1.1 million and 1.3 million performance-based stock options granted to
officers and key employees under the 2005 Plan during the years ended December 31, 2010 and 2009,
respectively. These performance-based stock options have a weighted average exercise price of $20.75, and a
term of ten years. These performance-based options have vestings that are tied to the achievement of certain
combined annual operating income targets. Upon the achievement of each of the combined operating income
targets, 50% of the options vest and the remaining 50% vest one year later. If certain lower levels of combined
operating income are achieved, fewer or no options vest at that time and one year later, and the remaining stock
options are forfeited. As of December 31, 2010, the combined operating income targets related to the
performance-based stock options granted during the year ended December 31, 2009 were met; 50% of the
options vested on February 15, 2011, and the remaining 50% will vest on February 15, 2012, subject to continued
employment.
The weighted average fair value of these performance-based stock options is $11.66, and was estimated
using the Black-Scholes option-pricing model consistent with the weighted average assumptions included in the
table above. During the years ended December 31, 2011 and 2010, the Company recorded $7.5 million and $6.2
million, respectively, in stock-based compensation expense for these performance-based stock options. As of
December 31, 2011, the Company had $7.3 million of unrecognized compensation expense expected to be
recognized over a weighted average period of 1.8 years.
68