Under Armour 2011 Annual Report Download - page 44
Download and view the complete annual report
Please find page 44 of the 2011 Under Armour annual report below. You can navigate through the pages in the report by either clicking on the pages listed below, or by using the keyword search tool below to find specific information within the annual report.-
 1
1 -
2
-
3
-
4
-
5
-
6
-
7
-
8
-
9
-
10
-
11
-
12
-
13
-
14
-
15
-
16
-
17
-
18
-
19
-
20
-
21
-
22
-
23
-
24
-
25
-
26
-
27
-
28
-
29
-
30
-
31
-
32
-
33
-
 34
34 -
 35
35 -
 36
36 -
 37
37 -
 38
38 -
 39
39 -
 40
40 -
 41
41 -
 42
42 -
 43
43 -
 44
44 -
 45
45 -
 46
46 -
 47
47 -
 48
48 -
 49
49 -
 50
50 -
 51
51 -
 52
52 -
 53
53 -
 54
54 -
55
-
56
-
57
-
58
-
59
-
60
-
61
-
62
-
63
-
64
-
65
-
66
-
67
-
68
-
69
-
70
-
71
-
72
-
73
-
74
-
75
-
76
-
77
-
78
-
79
-
80
-
81
-
82
-
83
-
84
-
85
-
86
-
87
-
88
-
89
-
90
-
91
-
92
-
93
-
94
-
95
-
96
 |
 |

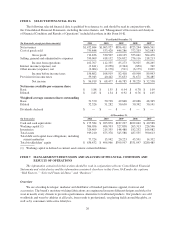
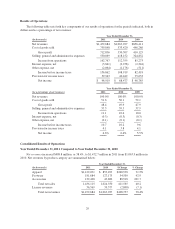
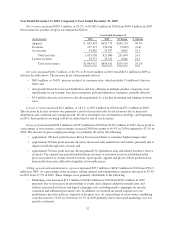
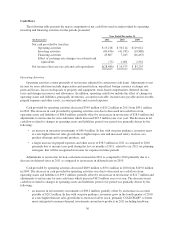
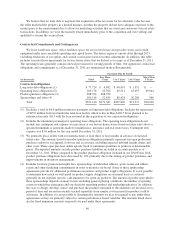
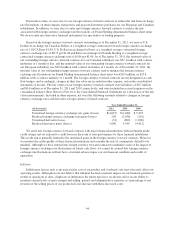
Operating income by geographic region is summarized below:
Year Ended December 31,
(In thousands) 2011 2010 $ Change % Change
North America $150,559 $102,806 $47,753 46.4%
Other foreign countries 12,208 9,549 2,659 27.8
Total operating income $162,767 $112,355 $50,412 44.9%
Operating income in our North American operating segment increased $47.8 million to $150.6 million in
2011 from $102.8 million in 2010 primarily due to the items discussed above in the Consolidated Results of
Operations. Operating income in other foreign countries increased by $2.7 million to $12.2 million in 2011 from
$9.5 million in 2010 primarily due to increased unit sales growth as discussed above, partially offset by higher
costs associated with our continued investment to support our international expansion in our EMEA, Asian and
Latin American operating segments.
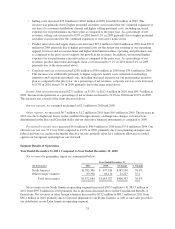
Year Ended December 31, 2010 Compared to Year Ended December 31, 2009
Net revenues by geographic region are summarized below:
Year Ended December 31,
(In thousands) 2010 2009 $ Change % Change
North America $ 997,816 $808,020 $189,796 23.5%
Other foreign countries 66,111 48,391 17,720 36.6
Total net revenues $1,063,927 $856,411 $207,516 24.2%
Net revenues in our North American operating segment increased $189.8 million to $997.8 million in 2010
from $808.0 million in 2009 primarily due to the items discussed above in the Consolidated Results of
Operations. Net revenues in other foreign countries increased by $17.7 million to $66.1 million in 2010 from
$48.4 million in 2009 primarily due to increased apparel unit sales in our EMEA operating segment and
increased product distribution by our licensee in Japan.
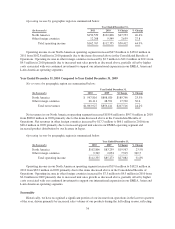
Operating income by geographic region is summarized below:
Year Ended December 31,
(In thousands) 2010 2009 $ Change % Change
North America $102,806 $83,239 $19,567 23.5%
Other foreign countries 9,549 2,034 7,515 369.5
Total operating income $112,355 $85,273 $27,082 31.8%
Operating income in our North American operating segment increased $19.6 million to $102.8 million in
2010 from $83.2 million in 2009 primarily due to the items discussed above in the Consolidated Results of
Operations. Operating income in other foreign countries increased by $7.5 million to $9.5 million in 2010 from
$2.0 million in 2009 primarily due to increased unit sales growth as discussed above, partially offset by higher
costs associated with our continued investment to support our international expansion in our EMEA, Asian and
Latin American operating segments.
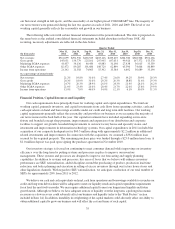
Seasonality
Historically, we have recognized a significant portion of our income from operations in the last two quarters
of the year, driven primarily by increased sales volume of our products during the fall selling season, reflecting
34