Under Armour 2011 Annual Report Download - page 45
Download and view the complete annual report
Please find page 45 of the 2011 Under Armour annual report below. You can navigate through the pages in the report by either clicking on the pages listed below, or by using the keyword search tool below to find specific information within the annual report.-
 1
1 -
2
-
3
-
4
-
5
-
6
-
7
-
8
-
9
-
10
-
11
-
12
-
13
-
14
-
15
-
16
-
17
-
18
-
19
-
20
-
21
-
22
-
23
-
24
-
25
-
26
-
27
-
28
-
29
-
30
-
31
-
32
-
33
-
34
-
 35
35 -
 36
36 -
 37
37 -
 38
38 -
 39
39 -
 40
40 -
 41
41 -
 42
42 -
 43
43 -
 44
44 -
 45
45 -
 46
46 -
 47
47 -
 48
48 -
 49
49 -
 50
50 -
 51
51 -
 52
52 -
 53
53 -
 54
54 -
 55
55 -
56
-
57
-
58
-
59
-
60
-
61
-
62
-
63
-
64
-
65
-
66
-
67
-
68
-
69
-
70
-
71
-
72
-
73
-
74
-
75
-
76
-
77
-
78
-
79
-
80
-
81
-
82
-
83
-
84
-
85
-
86
-
87
-
88
-
89
-
90
-
91
-
92
-
93
-
94
-
95
-
96
 |
 |
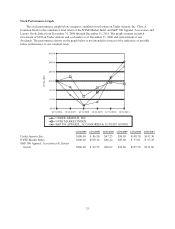
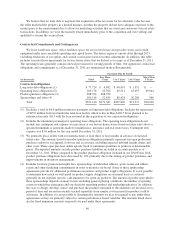
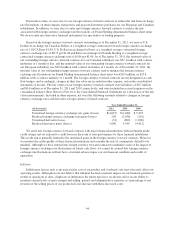
our historical strength in fall sports, and the seasonality of our higher priced COLDGEAR®line. The majority of
our net revenues were generated during the last two quarters in each of 2011, 2010 and 2009. The level of our
working capital generally reflects the seasonality and growth in our business.
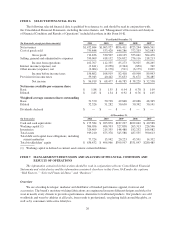
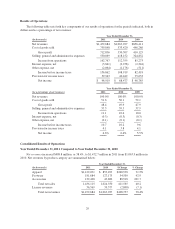
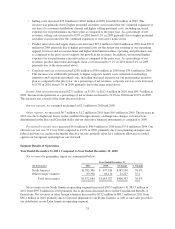
The following table sets forth certain financial information for the periods indicated. The data is prepared on
the same basis as the audited consolidated financial statements included elsewhere in this Form 10-K. All
recurring, necessary adjustments are reflected in the data below.
Quarter Ended
(In thousands)
Mar 31,
2011
Jun 30,
2011
Sep 30,
2011
Dec 31,
2011
Mar 31,
2010
Jun 30,
2010
Sep 30,
2010
Dec 31,
2010
Net revenues $312,699 $291,336 $465,523 $403,126 $229,407 $204,786 $328,568 $301,166
Gross profit 145,051 134,779 225,101 207,905 107,631 99,926 167,372 155,578
Marketing SG&A expenses 41,437 34,136 48,450 43,883 31,198 27,438 36,015 33,539
Other SG&A expenses 82,472 89,285 101,686 108,720 62,849 65,596 74,668 86,849
Income from operations 21,142 11,358 74,965 55,302 13,584 6,892 56,689 35,190
(As a percentage of annual totals)
Net revenues 21.2% 19.8% 31.6% 27.4% 21.6% 19.2% 30.9% 28.3%
Gross profit 20.3% 18.9% 31.6% 29.2% 20.3% 18.8% 31.6% 29.3%
Marketing SG&A expenses 24.7% 20.3% 28.9% 26.1% 24.3% 21.4% 28.1% 26.2%
Other SG&A expenses 21.6% 23.4% 26.6% 28.4% 21.7% 22.6% 25.8% 29.9%
Income from operations 13.0% 7.0% 46.0% 34.0% 12.1% 6.1% 50.5% 31.3%
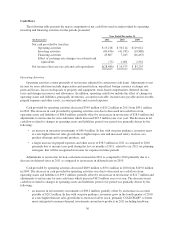
Financial Position, Capital Resources and Liquidity
Our cash requirements have principally been for working capital and capital expenditures. We fund our
working capital, primarily inventory, and capital investments from cash flows from operating activities, cash and
cash equivalents on hand and borrowings available under our credit and long term debt facilities. Our working
capital requirements generally reflect the seasonality and growth in our business as we recognize the majority of
our net revenues in the back half of the year. Our capital investments have included expanding our in-store
fixture and branded concept shop program, improvements and expansion of our distribution and corporate
facilities to support our growth, leasehold improvements to our new factory house and specialty stores, and
investment and improvements in information technology systems. Our capital expenditures in 2011 included the
acquisition of our corporate headquarters for $60.5 million along with approximately $2.2 million in additional
related investments and improvements. In connection with the acquisition, we assumed a $38.6 million loan
secured by the acquired property. The remaining purchase price was funded through a $25.0 million term loan. A
$1.0 million deposit was paid upon signing the purchase agreement in November 2010.
Our inventory strategy is focused on continuing to meet consumer demand while improving our inventory
efficiency over the long term by putting systems and processes in place to improve our inventory
management. These systems and processes are designed to improve our forecasting and supply planning
capabilities. In addition to systems and processes, key areas of focus that we believe will enhance inventory
performance are SKU rationalization, added discipline around the purchasing of product, production lead time
reduction, and better planning and execution in selling of excess inventory through our factory house stores and
other liquidation channels. With regards to SKU rationalization, we anticipate a reduction of our total number of
SKUs by approximately 20% from 2011 to 2012.
We believe our cash and cash equivalents on hand, cash from operations and borrowings available to us under our
credit and long term debt facilities will be adequate to meet our liquidity needs and capital expenditure requirements
for at least the next twelve months. We may require additional capital to meet our longer term liquidity and future
growth needs. Although we believe we have adequate sources of liquidity over the long term, a prolonged economic
recession or a slow recovery could adversely affect our business and liquidity (refer to the “Risk Factors” section
included in Item 1A). In addition, instability in or tightening of the capital markets could adversely affect our ability to
obtain additional capital to grow our business and will affect the cost and terms of such capital.
35