Under Armour 2011 Annual Report Download - page 38
Download and view the complete annual report
Please find page 38 of the 2011 Under Armour annual report below. You can navigate through the pages in the report by either clicking on the pages listed below, or by using the keyword search tool below to find specific information within the annual report.-
 1
1 -
2
-
3
-
4
-
5
-
6
-
7
-
8
-
9
-
10
-
11
-
12
-
13
-
14
-
15
-
16
-
17
-
18
-
19
-
20
-
21
-
22
-
23
-
24
-
25
-
26
-
27
-
 28
28 -
 29
29 -
 30
30 -
 31
31 -
 32
32 -
 33
33 -
 34
34 -
 35
35 -
 36
36 -
 37
37 -
 38
38 -
 39
39 -
 40
40 -
 41
41 -
 42
42 -
 43
43 -
 44
44 -
 45
45 -
 46
46 -
 47
47 -
 48
48 -
49
-
50
-
51
-
52
-
53
-
54
-
55
-
56
-
57
-
58
-
59
-
60
-
61
-
62
-
63
-
64
-
65
-
66
-
67
-
68
-
69
-
70
-
71
-
72
-
73
-
74
-
75
-
76
-
77
-
78
-
79
-
80
-
81
-
82
-
83
-
84
-
85
-
86
-
87
-
88
-
89
-
90
-
91
-
92
-
93
-
94
-
95
-
96
 |
 |
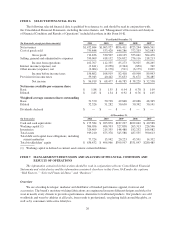
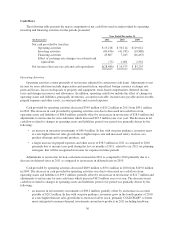
oil. In general, as a percentage of net revenues, we expect cost of goods sold associated with our apparel and
accessories to be lower than that of our footwear. No cost of goods sold is associated with license revenues.
We include outbound freight costs associated with shipping goods to customers as cost of goods sold;
however, we include the majority of outbound handling costs as a component of selling, general and
administrative expenses. As a result, our gross profit may not be comparable to that of other companies that
include outbound handling costs in their cost of goods sold. Outbound handling costs include costs associated
with preparing goods to ship to customers and certain costs to operate our distribution facilities. These costs were
$26.1 million, $14.7 million and $12.2 million for the years ended December 31, 2011, 2010 and 2009,
respectively.
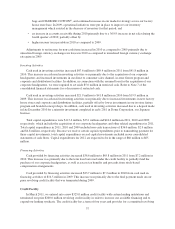
Our selling, general and administrative expenses consist of costs related to marketing, selling, product
innovation and supply chain and corporate services. Personnel costs are included in these categories based on the
employees’ function. Personnel costs include salaries, benefits, incentives and stock-based compensation related
to the employee. Our marketing costs are an important driver of our growth. Marketing costs consist primarily of
commercials, print ads, league, team, player and event sponsorships, amortization of footwear promotional rights
and depreciation expense specific to our in-store fixture program. In addition, marketing costs include costs
associated with our Special Make-Up Shop (“SMU Shop”) located at one of our distribution facilities where we
manufacture a limited number of products primarily for our league, team, player and event sponsorships. Selling
costs consist primarily of costs relating to sales through our wholesale channel, commissions paid to third parties
and the majority of our direct to consumer sales channel costs, including the cost of factory house and specialty
store leases. Product innovation and supply chain costs include our apparel, footwear and accessories product
innovation, sourcing and development costs, distribution facility operating costs, and costs relating to our Hong
Kong and Guangzhou, China offices which help support product development, manufacturing, quality assurance
and sourcing efforts. Corporate services primarily consist of corporate facility operating costs and company-wide
administrative expenses.
Other expense, net consists of unrealized and realized gains and losses on our derivative financial
instruments and unrealized and realized gains and losses on adjustments that arise from fluctuations in foreign
currency exchange rates relating to transactions generated by our international subsidiaries.
28