Under Armour 2011 Annual Report Download - page 60
Download and view the complete annual report
Please find page 60 of the 2011 Under Armour annual report below. You can navigate through the pages in the report by either clicking on the pages listed below, or by using the keyword search tool below to find specific information within the annual report.-
 1
1 -
2
-
3
-
4
-
5
-
6
-
7
-
8
-
9
-
10
-
11
-
12
-
13
-
14
-
15
-
16
-
17
-
18
-
19
-
20
-
21
-
22
-
23
-
24
-
25
-
26
-
27
-
28
-
29
-
30
-
31
-
32
-
33
-
34
-
35
-
36
-
37
-
38
-
39
-
40
-
41
-
42
-
43
-
44
-
45
-
46
-
47
-
48
-
49
-
 50
50 -
 51
51 -
 52
52 -
 53
53 -
 54
54 -
 55
55 -
 56
56 -
 57
57 -
 58
58 -
 59
59 -
 60
60 -
 61
61 -
 62
62 -
 63
63 -
 64
64 -
 65
65 -
 66
66 -
 67
67 -
 68
68 -
 69
69 -
 70
70 -
71
-
72
-
73
-
74
-
75
-
76
-
77
-
78
-
79
-
80
-
81
-
82
-
83
-
84
-
85
-
86
-
87
-
88
-
89
-
90
-
91
-
92
-
93
-
94
-
95
-
96
 |
 |

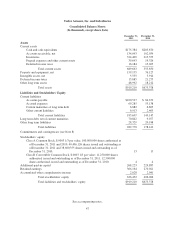
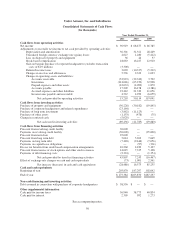
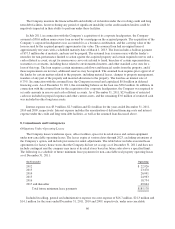
Under Armour, Inc. and Subsidiaries
Consolidated Statements of Cash Flows
(In thousands)
Year Ended December 31,
2011 2010 2009
Cash flows from operating activities
Net income $ 96,919 $ 68,477 $ 46,785
Adjustments to reconcile net income to net cash provided by operating activities
Depreciation and amortization 36,301 31,321 28,249
Unrealized foreign currency exchange rate (gains) losses 4,027 1,280 (5,222)
Loss on disposal of property and equipment 36 44 37
Stock-based compensation 18,063 16,227 12,910
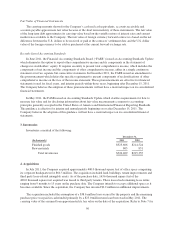
Gain on bargain purchase of corporate headquarters (excludes transaction
costs of $1.9 million) (3,300) — —
Deferred income taxes 3,620 (10,337) (5,212)
Changes in reserves and allowances 5,536 2,322 1,623
Changes in operating assets and liabilities:
Accounts receivable (33,923) (32,320) 3,792
Inventories (114,646) (65,239) 32,998
Prepaid expenses and other assets (42,633) (4,099) 1,870
Accounts payable 17,209 16,158 (4,386)
Accrued expenses and other liabilities 23,442 21,330 11,656
Income taxes payable and receivable 4,567 4,950 (6,059)
Net cash provided by operating activities 15,218 50,114 119,041
Cash flows from investing activities
Purchase of property and equipment (56,228) (30,182) (19,845)
Purchase of corporate headquarters and related expenditures (23,164) — —
Purchase of long term investment (3,862) (11,125) —
Purchases of other assets (1,153) (478) (35)
Change in restricted cash (5,029) — —
Net cash used in investing activities (89,436) (41,785) (19,880)
Cash flows from financing activities
Proceeds from revolving credit facility 30,000 — —
Payments on revolving credit facility (30,000) — (25,000)
Proceeds from term loan 25,000 — —
Proceeds from long term debt 5,644 5,262 7,649
Payments on long term debt (7,418) (9,446) (7,656)
Payments on capital lease obligations — (97) (361)
Excess tax benefits from stock-based compensation arrangements 10,260 4,189 5,127
Proceeds from exercise of stock options and other stock issuances 14,645 7,335 5,128
Payments of debt financing costs (2,324) — (1,354)
Net cash provided by (used in) financing activities 45,807 7,243 (16,467)
Effect of exchange rate changes on cash and cash equivalents (75) 1,001 2,561
Net increase (decrease) in cash and cash equivalents (28,486) 16,573 85,255
Cash and cash equivalents
Beginning of year 203,870 187,297 102,042
End of year $ 175,384 $203,870 $187,297
Non-cash financing and investing activities
Debt assumed in connection with purchase of corporate headquarters $ 38,556 $ — $ —
Other supplemental information
Cash paid for income taxes 56,940 38,773 40,834
Cash paid for interest 2,305 992 1,273
See accompanying notes.
50