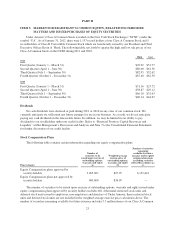
Under Armour 2011 Annual Report Download - page 41
Download and view the complete annual report
Please find page 41 of the 2011 Under Armour annual report below. You can navigate through the pages in the report by either clicking on the pages listed below, or by using the keyword search tool below to find specific information within the annual report.-
 1
1 -
2
-
3
-
4
-
5
-
6
-
7
-
8
-
9
-
10
-
11
-
12
-
13
-
14
-
15
-
16
-
17
-
18
-
19
-
20
-
21
-
22
-
23
-
24
-
25
-
26
-
27
-
28
-
29
-
30
-
 31
31 -
 32
32 -
 33
33 -
 34
34 -
 35
35 -
 36
36 -
 37
37 -
 38
38 -
 39
39 -
 40
40 -
 41
41 -
 42
42 -
 43
43 -
 44
44 -
 45
45 -
 46
46 -
 47
47 -
 48
48 -
 49
49 -
 50
50 -
 51
51 -
52
-
53
-
54
-
55
-
56
-
57
-
58
-
59
-
60
-
61
-
62
-
63
-
64
-
65
-
66
-
67
-
68
-
69
-
70
-
71
-
72
-
73
-
74
-
75
-
76
-
77
-
78
-
79
-
80
-
81
-
82
-
83
-
84
-
85
-
86
-
87
-
88
-
89
-
90
-
91
-
92
-
93
-
94
-
95
-
96
 |
 |
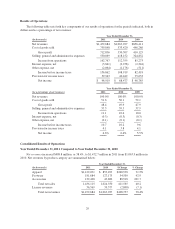
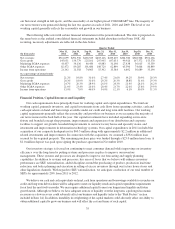
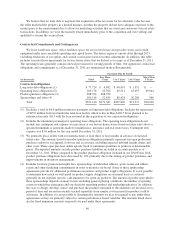
• Selling costs increased $44.2 million to $138.8 million for the year ended December 31, 2011 from
$94.6 million for the same period in 2010. This increase was primarily due to higher personnel and
other costs incurred for the continued expansion of our direct to consumer distribution channel and
higher selling personnel costs. As a percentage of net revenues, selling costs increased to 9.4% for the
year ended December 31, 2011 from 8.9% for the same period in 2010 primarily due to higher
personnel and other costs incurred for the continued expansion of our direct to consumer distribution
channel.
• Product innovation and supply chain costs increased $32.3 million to $129.1 million for the year ended
December 31, 2011 from $96.8 million for the same period in 2010 primarily due to higher distribution
facilities operating and personnel costs to support our growth in net revenues and higher personnel
costs for the design and sourcing of our expanding apparel, footwear and accessories lines. As a
percentage of net revenues, product innovation and supply chain costs decreased to 8.8% for the year
ended December 31, 2011 from 9.1% for the same period in 2010 primarily due to decreased personnel
costs for the design and sourcing of our expanding apparel, footwear and accessories lines as a
percentage of net revenues.
• Corporate services costs increased $15.7 million to $114.3 million for the year ended December 31,
2011 from $98.6 million for the same period in 2010. This increase was attributable primarily to
increased corporate personnel, facility costs and information technology initiatives necessary to support
our growth. As a percentage of net revenues, corporate services costs decreased to 7.7% for the year
ended December 31, 2011 from 9.3% for the same period in 2010 primarily due to decreased corporate
personnel and facility costs as a percentage of net revenues, as well as the net impact of the acquisition
of our corporate headquarters in 2011. The acquisition is not expected to have a material impact to our
consolidated statements of income in future periods.
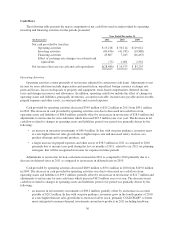
Income from operations increased $50.4 million, or 44.9%, to $162.8 million in 2011 from $112.4 million in
2010. Income from operations as a percentage of net revenues increased to 11.1% in 2011 from 10.6% in 2010.
This increase was a result of the items discussed above.
Interest expense, net increased $1.5 million to $3.8 million in 2011 from $2.3 million in 2010. This increase
was primarily due to the assumed loan for the acquisition of our corporate headquarters.
Other expense, net increased $0.9 million to $2.1 million in 2011 from $1.2 million in 2010. This increase
was due to higher net losses in 2011 on the combined foreign currency exchange rate changes on transactions
denominated in foreign currencies and our derivative financial instruments as compared to 2010.
Provision for income taxes increased $19.5 million to $59.9 million in 2011 from $40.4 million in 2010. Our
effective tax rate was 38.2% in 2011 compared to 37.1% in 2010, primarily due to federal and state tax credits
that reduced the effective tax rate in the prior year period, partially offset by the 2011 reversal of a valuation
allowance established in 2010 against a portion of our deferred tax assets related to foreign net operating loss
carryforwards.
31