Under Armour 2011 Annual Report Download - page 14
Download and view the complete annual report
Please find page 14 of the 2011 Under Armour annual report below. You can navigate through the pages in the report by either clicking on the pages listed below, or by using the keyword search tool below to find specific information within the annual report.-
 1
1 -
2
-
3
-
 4
4 -
 5
5 -
 6
6 -
 7
7 -
 8
8 -
 9
9 -
 10
10 -
 11
11 -
 12
12 -
 13
13 -
 14
14 -
 15
15 -
 16
16 -
 17
17 -
 18
18 -
 19
19 -
 20
20 -
 21
21 -
 22
22 -
 23
23 -
 24
24 -
25
-
26
-
27
-
28
-
29
-
30
-
31
-
32
-
33
-
34
-
35
-
36
-
37
-
38
-
39
-
40
-
41
-
42
-
43
-
44
-
45
-
46
-
47
-
48
-
49
-
50
-
51
-
52
-
53
-
54
-
55
-
56
-
57
-
58
-
59
-
60
-
61
-
62
-
63
-
64
-
65
-
66
-
67
-
68
-
69
-
70
-
71
-
72
-
73
-
74
-
75
-
76
-
77
-
78
-
79
-
80
-
81
-
82
-
83
-
84
-
85
-
86
-
87
-
88
-
89
-
90
-
91
-
92
-
93
-
94
-
95
-
96
 |
 |

products while maintaining the integrity of our brand. Through our specialty stores, consumers experience our
brand first-hand and have broader access to our performance products. In 2011, sales through our wholesale,
direct to consumer and licensing channels represented 70%, 27% and 3% of net revenues, respectively.
We operate in four geographic segments: (1) North America, (2) Europe, the Middle East and Africa
(“EMEA”), (3) Asia, and (4) Latin America. Each geographic segment operates predominantly in one industry:
the design, development, marketing and distribution of performance apparel, footwear and accessories. While our
international operating segments are currently not material and we combine them into other foreign countries for
reporting purposes, we believe that the trend toward performance products is global. We plan to continue to
introduce our products and simple merchandising story to athletes throughout the world. We are introducing our
performance apparel, footwear and accessories in a manner consistent with our past brand-building strategy,
including selling our products directly to teams and individual athletes in these markets, thereby providing us
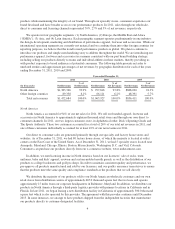
with product exposure to broad audiences of potential consumers. The following table presents net sales to
unrelated entities and approximate percentages of net revenues by geographic distribution for each of the years
ending December 31, 2011, 2010 and 2009:
Year ended December 31,
2011 2010 2009
(In thousands) Net Revenues
%of
Net Revenues Net Revenues
%of
Net Revenues Net Revenues
%of
Net Revenues
North America $1,383,346 93.9% $ 997,816 93.8% $808,020 94.3%
Other foreign countries 89,338 6.1% 66,111 6.2% 48,391 5.7%
Total net revenues $1,472,684 100.0% $1,063,927 100.0% $856,411 100.0%
North America
North America accounted for 94% of our net sales for 2011. We sell our branded apparel, footwear and
accessories in North America to approximately eighteen thousand retail stores and through our own direct to
consumer channels. In 2011, our two largest customers were, in alphabetical order, Dick’s Sporting Goods and
The Sports Authority. These two customers accounted for a total of 26% of our total net revenues in 2011, and
one of these customers individually accounted for at least 10% of our net revenues in 2011.
Our direct to consumer sales are generated primarily through our specialty and factory house stores and
websites. As of December 31, 2011, we had 80 factory house stores, of which the majority is located at outlet
centers on the East Coast of the United States. As of December 31, 2011, we had 5 specialty stores located near
Annapolis, Maryland, Chicago, Illinois, Boston, Massachusetts, Washington, D.C. and Vail, Colorado.
Consumers can purchase our products directly from our e-commerce website, www.underarmour.com.
In addition, we earn licensing income in North America based on our licensees’ sale of socks, team
uniforms, baby and kids’ apparel, eyewear and custom-molded mouth guards, as well as the distribution of our
products to college bookstores and golf pro shops. In order to maintain consistent quality and performance, we
pre-approve all products manufactured and sold by our licensees, and our quality assurance team strives to ensure
that the products meet the same quality and compliance standards as the products that we sell directly.
We distribute the majority of our products sold to our North American wholesale customers and our own
retail stores from distribution centers of approximately 667.0 thousand square feet that we lease and operate
approximately 15 miles from our corporate headquarters in Baltimore, Maryland. In addition, we distribute our
products in North America through a third-party logistics provider with primary locations in California and in
Florida. In late 2011, we began leasing a new distribution facility in California of approximately 300.0 thousand
square feet which is also operated by this provider. The agreement with this provider continues until December
2013. In some instances, we arrange to have products shipped from the independent factories that manufacture
our products directly to customer-designated facilities.
4