Under Armour 2011 Annual Report Download - page 42
Download and view the complete annual report
Please find page 42 of the 2011 Under Armour annual report below. You can navigate through the pages in the report by either clicking on the pages listed below, or by using the keyword search tool below to find specific information within the annual report.-
 1
1 -
2
-
3
-
4
-
5
-
6
-
7
-
8
-
9
-
10
-
11
-
12
-
13
-
14
-
15
-
16
-
17
-
18
-
19
-
20
-
21
-
22
-
23
-
24
-
25
-
26
-
27
-
28
-
29
-
30
-
31
-
 32
32 -
 33
33 -
 34
34 -
 35
35 -
 36
36 -
 37
37 -
 38
38 -
 39
39 -
 40
40 -
 41
41 -
 42
42 -
 43
43 -
 44
44 -
 45
45 -
 46
46 -
 47
47 -
 48
48 -
 49
49 -
 50
50 -
 51
51 -
 52
52 -
53
-
54
-
55
-
56
-
57
-
58
-
59
-
60
-
61
-
62
-
63
-
64
-
65
-
66
-
67
-
68
-
69
-
70
-
71
-
72
-
73
-
74
-
75
-
76
-
77
-
78
-
79
-
80
-
81
-
82
-
83
-
84
-
85
-
86
-
87
-
88
-
89
-
90
-
91
-
92
-
93
-
94
-
95
-
96
 |
 |

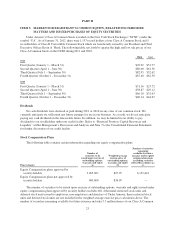
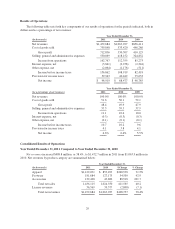
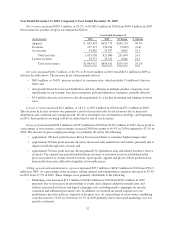
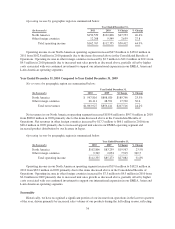
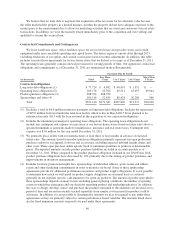
Year Ended December 31, 2010 Compared to Year Ended December 31, 2009
Net revenues increased $207.5 million, or 24.2%, to $1,063.9 million in 2010 from $856.4 million in 2009.
Net revenues by product category are summarized below:
Year Ended December 31,
(In thousands) 2010 2009 $ Change % Change
Apparel $ 853,493 $651,779 $201,714 30.9%
Footwear 127,175 136,224 (9,049) (6.6)
Accessories 43,882 35,077 8,805 25.1
Total net sales 1,024,550 823,080 201,470 24.5
License revenues 39,377 33,331 6,046 18.1
Total net revenues $1,063,927 $856,411 $207,516 24.2%
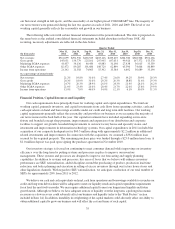
Net sales increased $201.5 million, or 24.5%, to $1,024.6 million in 2010 from $823.1 million in 2009 as
noted in the table above. The increase in net sales primarily reflects:
• $88.9 million, or 56.8%, increase in direct to consumer sales, which includes 19 additional stores in
2010; and
• unit growth driven by increased distribution and new offerings in multiple product categories, most
significantly in our training, base layer, mountain, golf and underwear categories; partially offset by
• $9.0 million decrease in footwear sales driven primarily by a decline in running and training footwear
sales.
License revenues increased $6.1 million, or 18.1%, to $39.4 million in 2010 from $33.3 million in 2009.
This increase in license revenues was primarily a result of increased sales by our licensees due to increased
distribution and continued unit volume growth. We have developed our own headwear and bags, and beginning
in 2011, these products are being sold by us rather than by one of our licensees.
Gross profit increased $120.4 million to $530.5 million in 2010 from $410.1 million in 2009. Gross profit as
a percentage of net revenues, or gross margin, increased 200 basis points to 49.9% in 2010 compared to 47.9% in
2009. The increase in gross margin percentage was primarily driven by the following:
• approximate 100 basis point increase driven by increased direct to consumer higher margin sales;
• approximate 50 basis point increase driven by decreased sales markdowns and returns, primarily due to
improved sell-through rates at retail; and
• approximate 50 basis point increase driven primarily by liquidation sales and related inventory reserve
reversals. The current year period benefited from reversals of inventory reserves established in the
prior year relative to certain cleated footwear, sport specific apparel and gloves. These products have
historically been more difficult to liquidate at favorable prices.
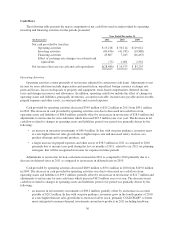
Selling, general and administrative expenses increased $93.3 million to $418.2 million in 2010 from $324.9
million in 2009. As a percentage of net revenues, selling, general and administrative expenses increased to 39.3%
in 2010 from 37.9% in 2009. These changes were primarily attributable to the following:
• Marketing costs increased $19.3 million to $128.2 million in 2010 from $108.9 million in 2009
primarily due to an increase in sponsorship of events and collegiate and professional teams and
athletes, increased television and digital campaign costs, including media campaigns for specific
customers and additional personnel costs. In addition, we incurred increased expenses for our
performance incentive plan as compared to the prior year. As a percentage of net revenues, marketing
costs decreased to 12.0% in 2010 from 12.7% in 2009 primarily due to decreased marketing costs for
specific customers.
32